Pest & Crop
Newsletter
Purdue Cooperative Extension Service
Purdue Cooperative Extension Service
Issue 23, September 1, 2017 • USDA-NIFA Extension IPM Grant
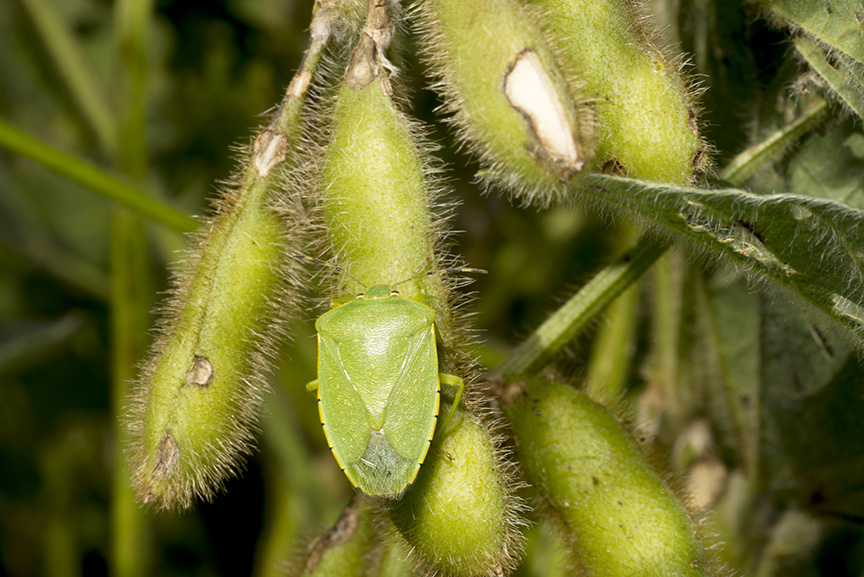
For the last couple of years, we’ve had reports of noticeable populations of green stink bug in Indiana soybean fields. Some suspected damaged seeds were sent to the Purdue Plant and Pest Diagnostic Lab for analysis during soybean harvest. Unfortunately, there was never conclusive evidence that stink bugs had damaged and reduced seed size, e.g., reduced yield. FYI, if you would like suspected stink bug damage to be inspected after senescence, please enclose whole pods, not just the seed with samples. This week, Larry Bledsoe, Entomology Field Research, sampled some southern Indiana soybean fields for an unrelated insect. However, what he found in a few fields at R5 growth stage, were large numbers of green stink bugs. He did emphasize that there was tremendous variability between fields. Although stink bugs are a key pest of soybeans in the southern US and South America, we don’t generally have treatable infestations this far north.
The green stink bug, a native of North America, is a flattened, shield-shaped bug, so named because of the offensive odor it produces. The adult is bright green and about 2/3 inch long. It is easily distinguished by the triangular-shaped plate that partially covers its wings and the characteristic foul odor they give off when handled. The nymphs hatch from clusters of barrel-shaped eggs. The nymphs (immatures) are wingless, black and red in color, and lack the triangular plate. Green stink bug may appear in soybean fields from mid July through harvest time.
Both green stink bug adults and nymphs feed using their piercing-sucking mouthparts. They cause injury to soybean by puncturing pods and sucking fluid from the developing beans. This feeding also introduces bacteria, fungi and yeasts that may cause further damage. Seeds that do develop despite stink bug pod feeding may be smaller, shriveled, and/or discolored. This damage may lower bean quality, and ultimately reduce yields.
If stink bugs are found in a field after the pods have begun to form, take 20 sweeps with a sweep net in each of 5 field areas. Determine the average number of bugs per sweep. Control may be necessary if there are 40 stink bugs per 100 sweeps (0.4 bugs/sweep) and pods are still green.
Should treatment be justified, a list of recommended insecticides can be found HERE. Consider the “Pre-Harvest Interval” for each of the listed products.
Green stink bug feeding on pod, also present is pod damage from bean leaf beetle.
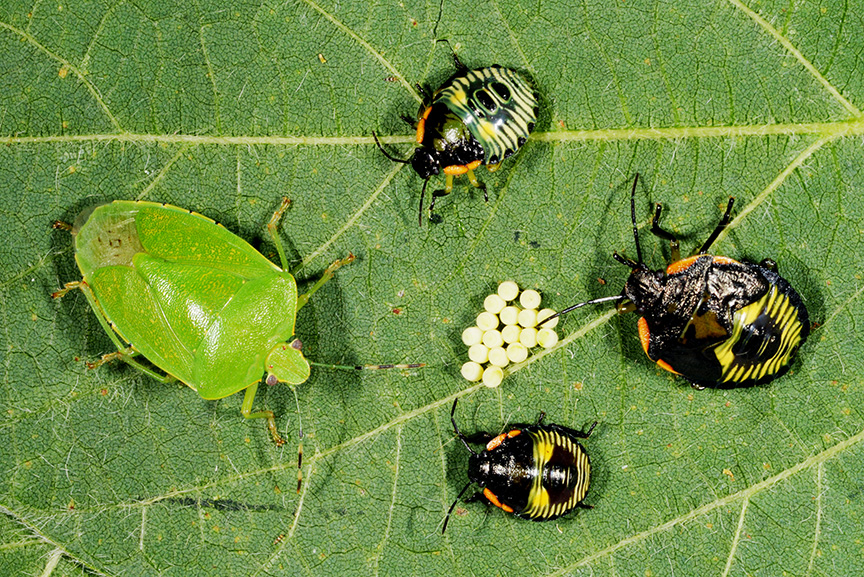
Green stink bug adult, eggs, and 3 nymph instars.
Thistle caterpillars, are generally dark in color, with conspicuous yellowish markings on their bodies. The larvae are covered with many branching spines. Larvae reach a length of about 1-1/4 inches. The larvae feed within webbed enclosures on the upper leaves and may defoliate entire patches of weeds and feed in a similar manner on soybean. The adult, painted lady butterfly, Vanessa cardui, is mostly orange mottled with black and white markings. This is a migratory species flying from and to Mexico and the Southwestern United States in the spring and fall. Adults arrive in Indiana in the spring and lay their eggs on several species of plants. Although they feed on many weed species, their preferred host is Canada thistle. Several generations occur in Indiana before they begin their migration southwestward in the fall. A true “beauty and the beast” story!
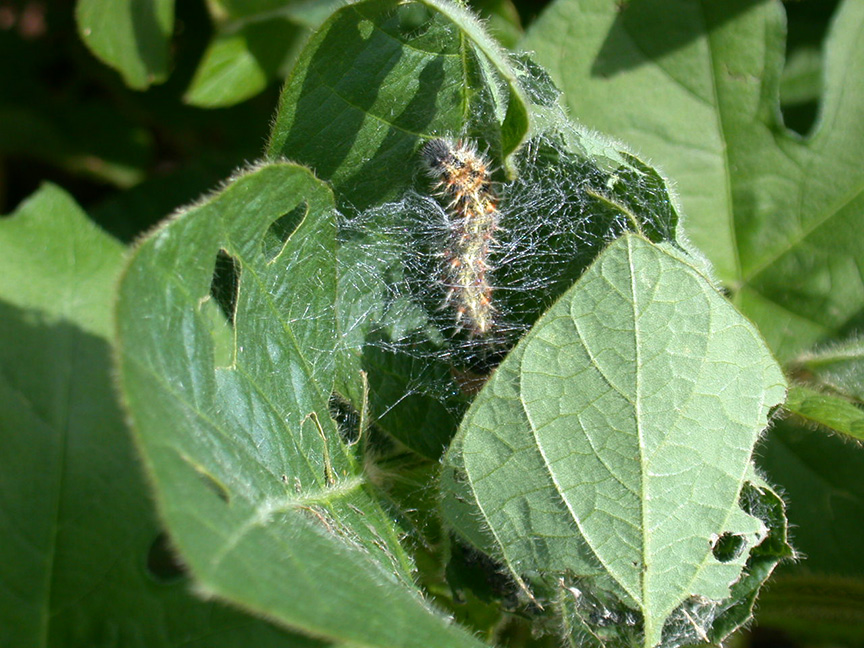
Thistle caterpillar within the webbed leaves.
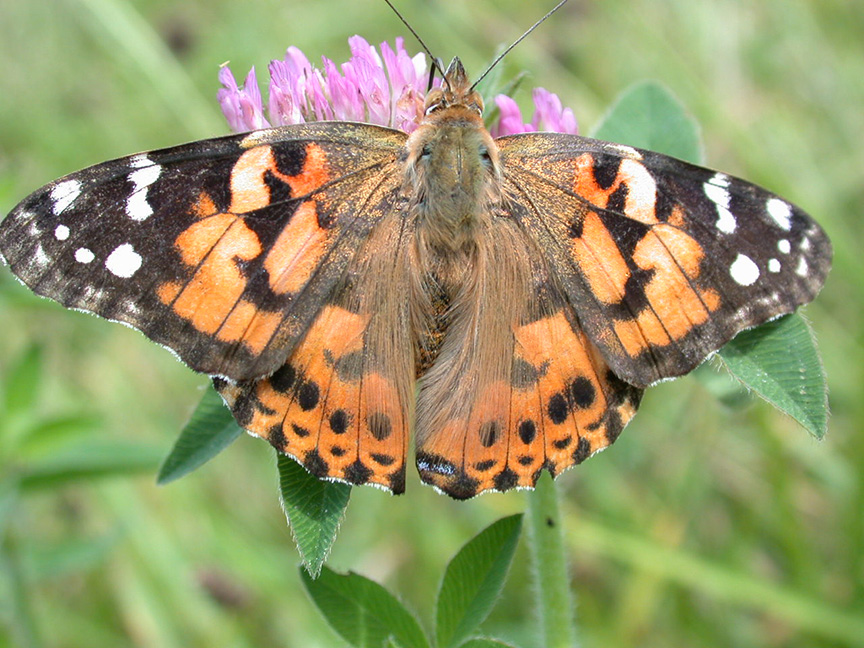
Painted lady butterfly feeding on clover.
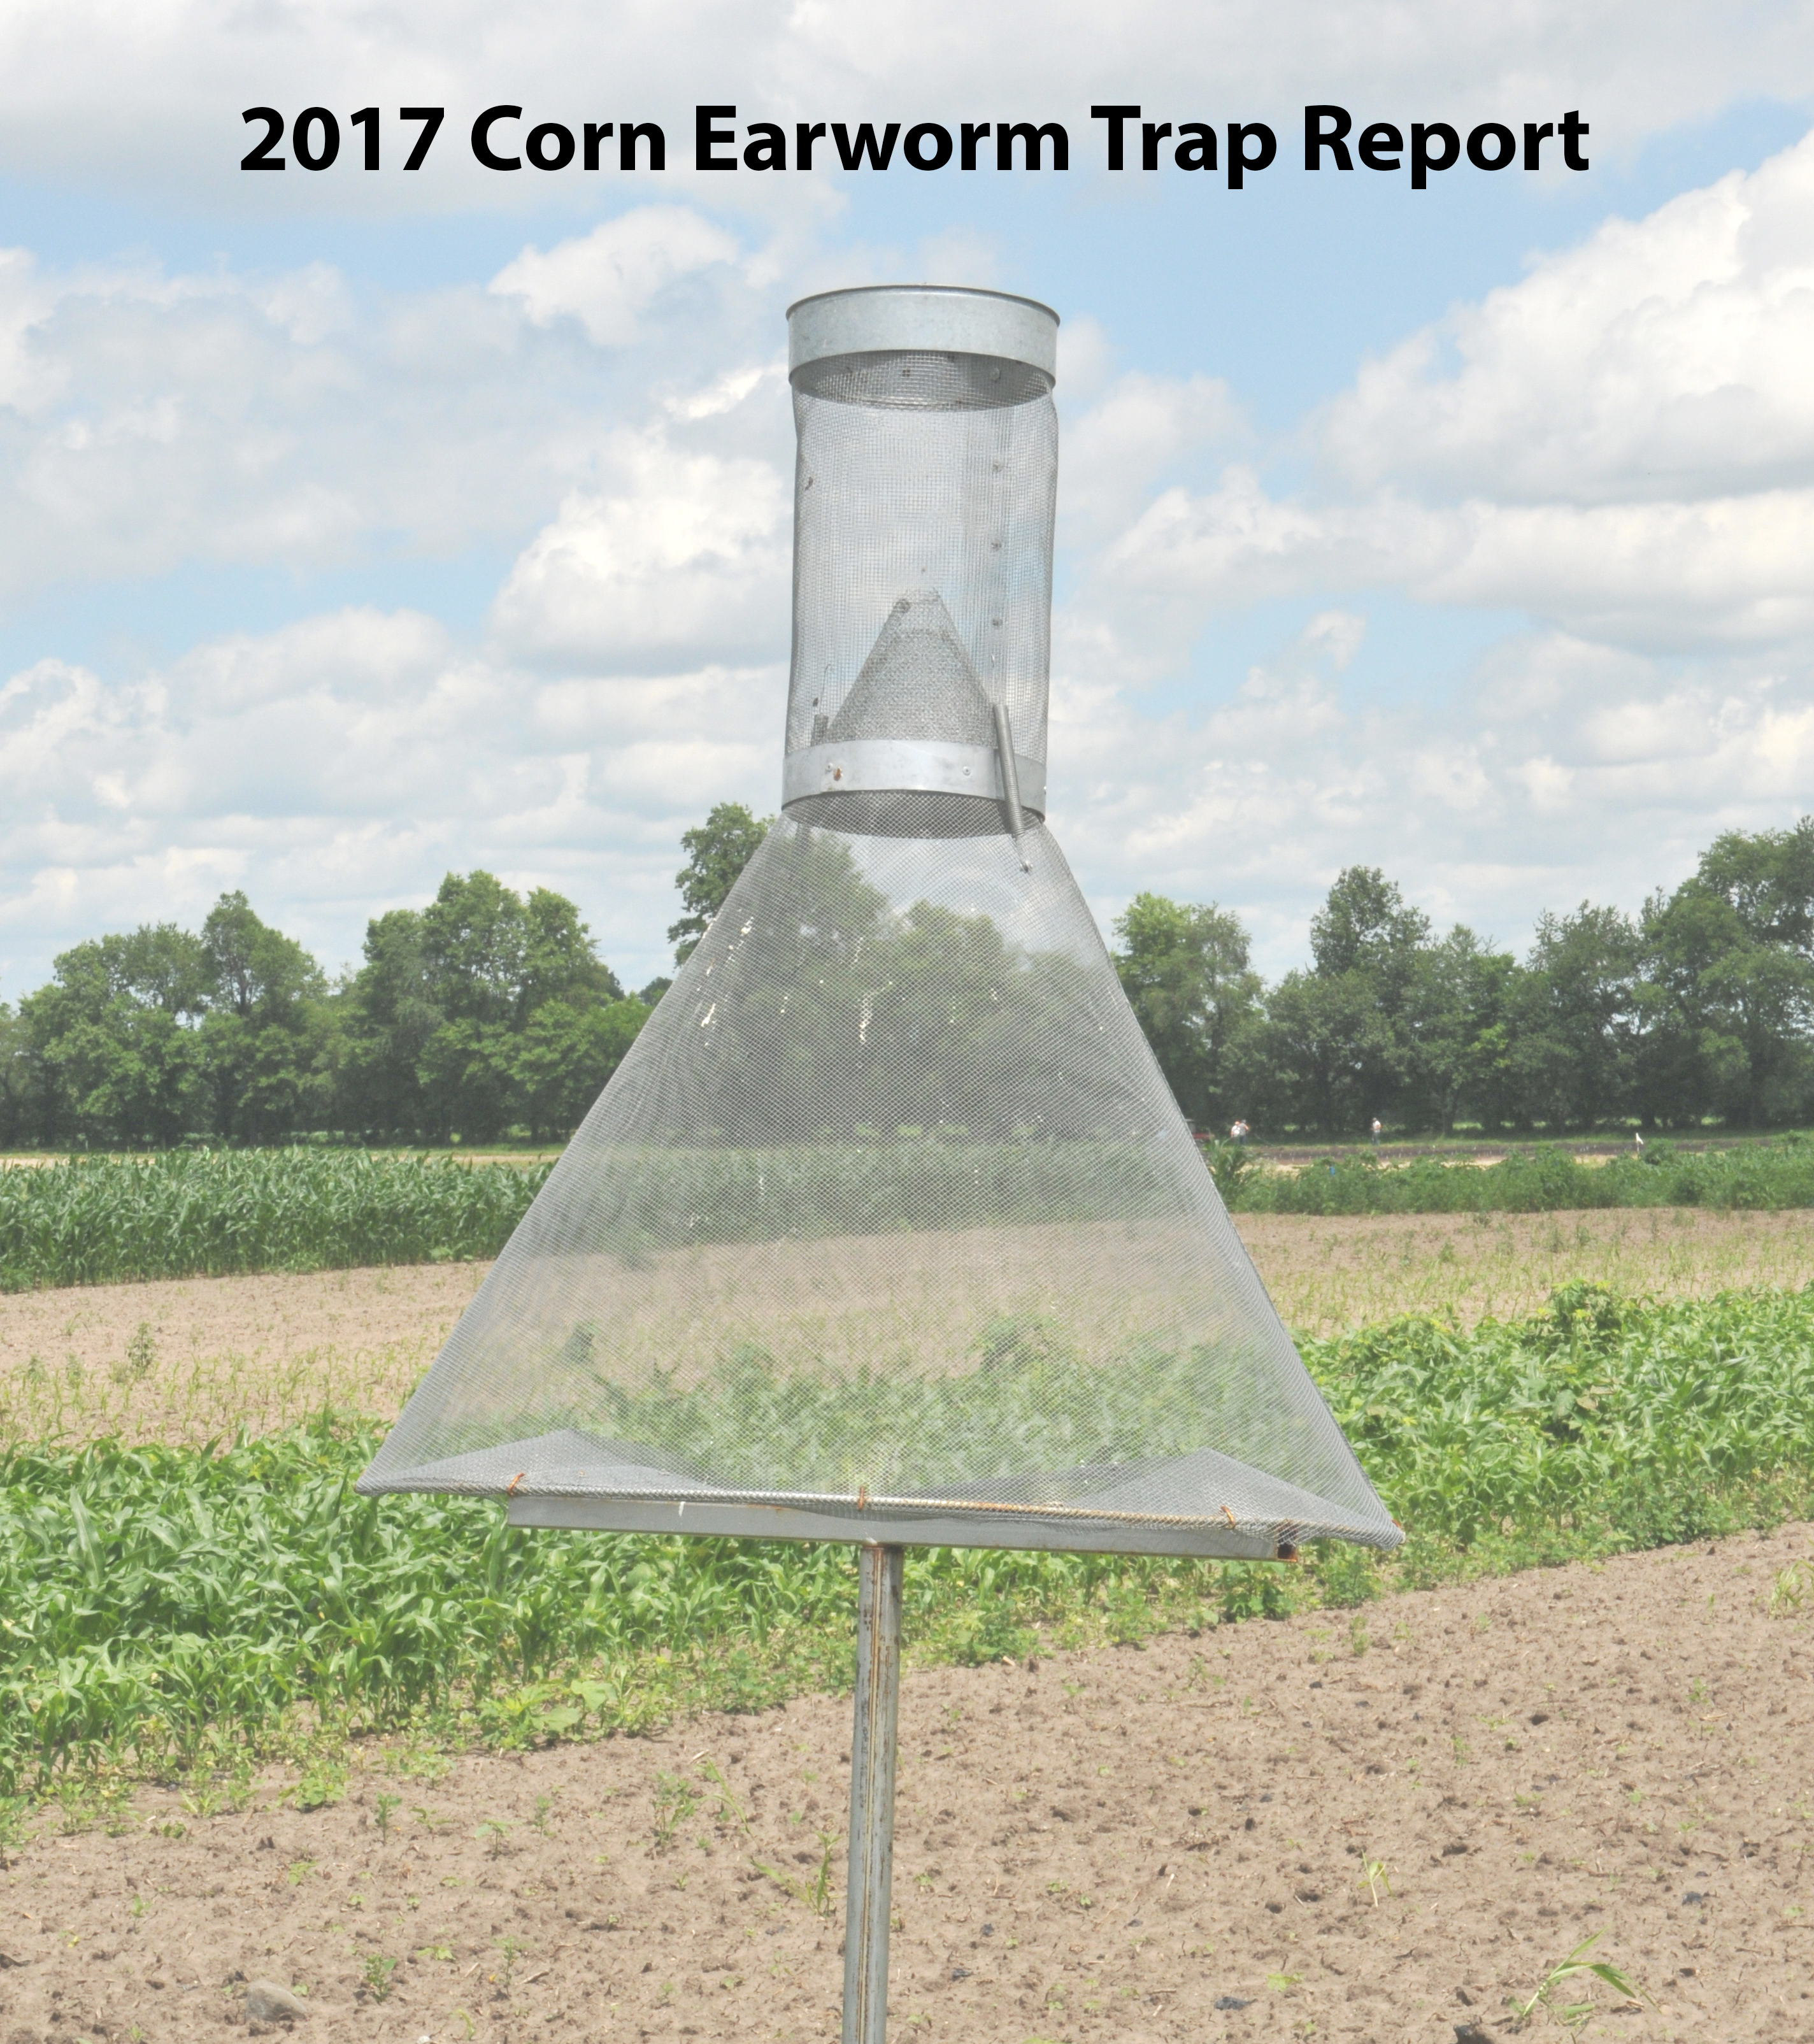
Corn Earworm Trap Report
Now that the spray season for herbicides in corn and soybean has ended for most of Indiana and dicamba complaints have started to slow down, we thought it would be an interesting exercise to see how many spray hours we had this season for the approved dicamba products in Xtend soybean. With the cool, wet weather that dominated most of May, many postemergence herbicide treatments were not applied until the months of June and July. We decided to take a look at hourly weather data from the Agronomy Center for Research and Education (ACRE) near West Lafayette to see how many hours we could have applied Xtendimax or FeXapan to Xtend soybeans in June and July at that location.
We first looked at rainfall data to determine how many days in each month that equipment traffic would not be possible on the farm. In addition to eliminating the days where equipment traffic was not possible, we removed the 24-hour period leading up to rainfall events since the Xtendimax and FeXapan labels do not allow applications of the product when rain is forecast within the next 24 hours. Once we removed the hours and days where we could not spray due to soil conditions or label restrictions with regard to forecast rainfall, we examined hourly wind conditions to determine how many hours we could apply these approved dicamba products.
Xtendimax and FeXapan do not allow applications of the product when wind speeds are below 3 MPH or above 15 MPH. Using these parameters, we looked at hourly weather data to determine when the average wind speeds allowed applications. When combing over the data, we noticed that there were several hours with wind gusts well over 15 MPH. With this in mind, we further refined that data to calculate hours when wind speeds were between 3 and 15 MPH, including wind gusts, which we called “ideal” spray hours. We chose these products because without access to actual temperature inversion data, it would be more difficult to retroactively calculate Engenia application hours. Engenia will allow applications with wind speeds under 3 MPH, but places the responsibility on the applicator to confirm no temperature inversion is present.
When we added up all the sprayable hours in June, we found that we could apply Xtendimax and FeXapan for 334 hours in June (46% of the month). We calculated 184 ideal spray hours in June (26% of the month). Figure 1 shows a calendar for the month of June. If a day is red, that was a day with 0 application hours. Days in green had more than 8 ideal application hours in a given day, whereas yellow days had less than 8 ideal application hours. We ultimately came up with 13 days in June where we could not apply these products, 13 days with at least 8 ideal spray hours, and 4 marginal days in the month of June.
July ended up being less windy than June was, yet we ended up with fewer spray hours. Many nights in July had wind speeds below 3 MPH, making applications off-label at those hours. When we totaled the hours up, we had 267 spray hours in July (36% of the month), and 250 ideal spray hours (34% of the month). If we were to factor in the cut-off of applications once soybeans reach the R2 growth stage, many fields would have considerably fewer spray hours in July as crops progressed through early reproductive stages. Figure 2 is set up similarly to figure 1, but shows the spray days in the month of July. Like June, we had 13 days where we could not apply Xtendimax or FeXapan in July. We did have more days in July with greater than 8 ideal spray hours, but due to low overnight wind speeds we ended up with fewer hours to spray throughout the month.
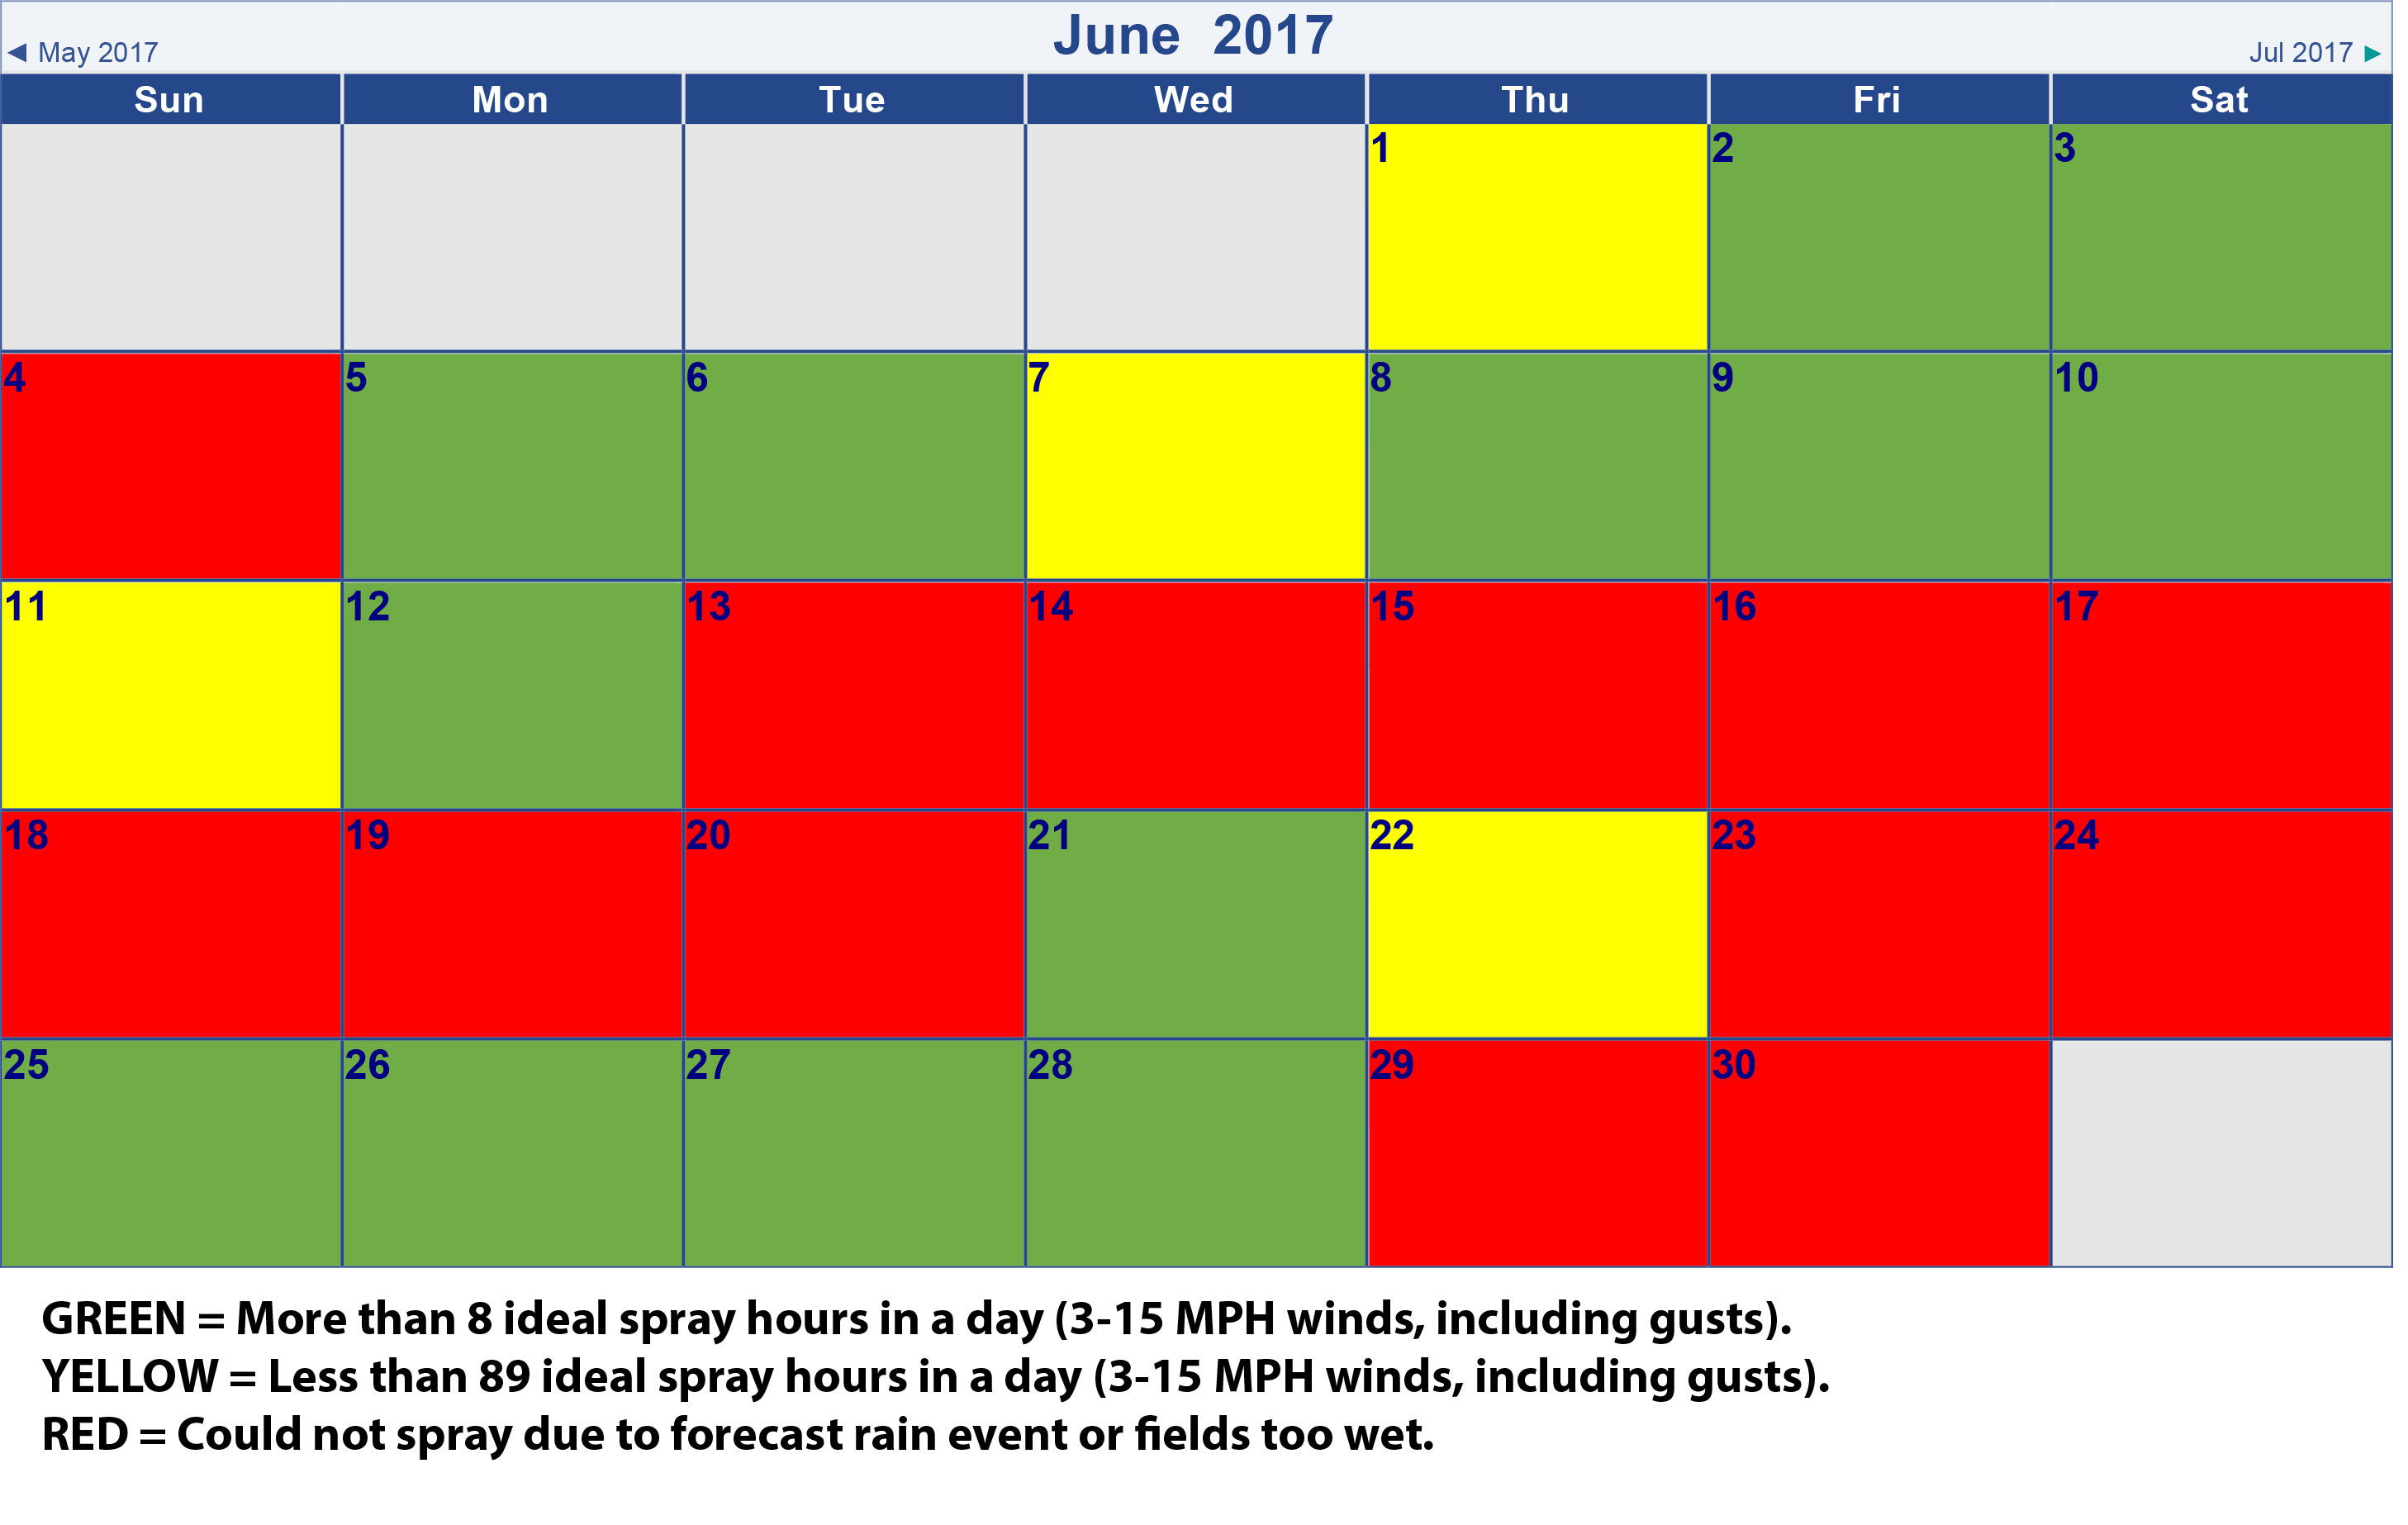
Figure 1. Spray days in June 2017 at the Agronomy Center for Research and Education (ACRE) near West Lafayette, IN. If a box is red, there were no spray hours that day due to field conditions or forecast rainfall. If a box is green, there were more than 8 hours in a day where winds were between 3 and 15 MPH (including gusts). If a box is yellow, there were less than 8 hours in a day where winds were between 3 and 15 MPH (including gusts).
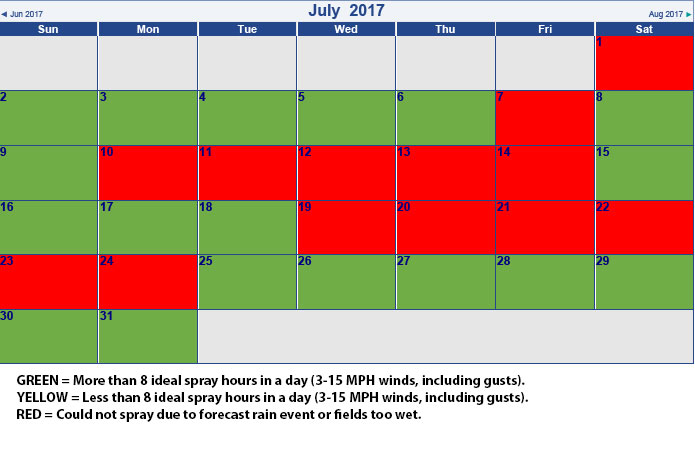
Figure 2. Spray days in July 2017 at the Agronomy Center for Research and Education (ACRE) near West Lafayette, IN. If a box is red, there were no spray hours that day due to field conditions or forecast rainfall. If a box is green, there were more than 8 hours in a day where winds were between 3 and 15 MPH (including gusts). If a box is yellow, there were less than 8 hours in a day where winds were between 3 and 15 MPH (including gusts).
After the off-target movement issues with dicamba this year, there is a great possibility of some label changes heading into the 2018 growing season. Without knowing what label changes may come to Indiana, we decided to take a look at spray hours if we were to operate under Missouri’s emergency rules put into place for this summer. These additional rules only allowed applications between 9 AM and 3 PM, and cut off applications at a wind speed of 10 MPH. Figures 3 and 4 show spray hours in the months of June and July, respectively, if we had those rules in place for 2017. We calculated only 49 hours in June, including a 12-day period where we only had 2 hours to apply the approved products. The low number of spray hours in June is alarming, especially once you factor in that dicamba is not a good herbicide on large weeds. When trying to control weeds like waterhemp and Palmer amaranth, 2 spray hours in a 12 day period almost guarantees these weeds will be above the 4-inch height limit on approved dicamba labels when the opportunity to spray comes again.
Decisions for the use of dicamba in Xtend soybeans will be coming over the next few weeks or months. By looking at weather data at one location in 2017, we can see that finding time to make applications according to current product labels was challenging in a wet year like we saw in most of Indiana this year. Furthermore, if we had implemented tighter time of day and wind restrictions, it would have been extremely challenging to spray the approved dicamba products in June when many postemergence herbicide applications were needed. It certainly highlighted the difficulty of applying these products in a way to minimize off target movement while also expecting excellent weed control in a year where weather conditions made timely spray applications a challenge across the state.
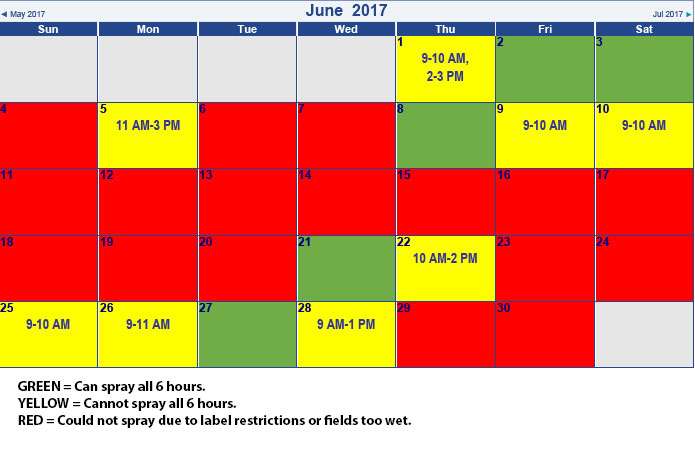
Figure 3. Spray days and hours in June 2017 at the at the Agronomy Center for Research and Education (ACRE) near West Lafayette, IN if Indiana adopted stricter rules that only allowed dicamba applications between 9 AM and 3 PM, and if wind speeds were between 3 and 10 MPH. If a box is red it means that no applications could be made that day. If a box is green, it means applications could be made from 9 AM through 3 PM. If a box is yellow, it means there were some hours between 9 AM and 3 PM that spray applications could not be made. The numbers inside the yellow boxes are the hours that applications could be made.
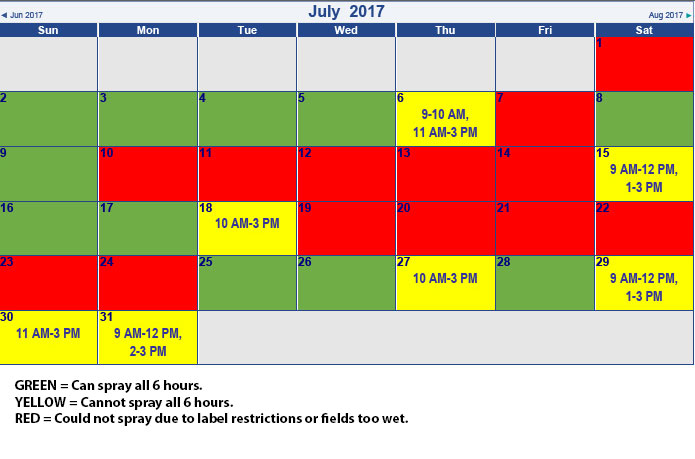
Figure 4. Spray days and hours in July 2017 at the at the Agronomy Center for Research and Education (ACRE) near West Lafayette, IN if Indiana adopted stricter rules that only allowed dicamba applications between 9 AM and 3 PM, and if wind speeds were between 3 and 10 MPH. If a box is red it means that no applications could be made that day. If a box is green, it means applications could be made from 9 AM through 3 PM. If a box is yellow, it means there were some hours between 9 AM and 3 PM that spray applications could not be made. The numbers inside the yellow boxes are the hours that applications could be made.
Purdue Cooperative Extension Service
Purdue Extension Entomology
901 W. State Street
West Lafayette, IN, 47907
(765) 494-8761
luck@purdue.edu
@PurdueExtEnt
PurdueEntomology
If you would like to be alerted by e-mail when the current issue of the Pest&Crop is available on-line, please enter your e-mail address and click the submit button.
It is the policy of the Purdue University Cooperative Extension Service that all persons have equal opportunity and access to its educational programs, services, activities, and facilities without regard to race, religion, color, sex, age, national origin or ancestry, marital status, parental status, sexual orientation, disability or status as a veteran. Purdue University is an Affirmative Action institution. This material may be available in alternative formats.