Pest & Crop
Newsletter
Purdue Cooperative Extension Service
Purdue Cooperative Extension Service
Issue 21, August 17, 2017 • USDA-NIFA Extension IPM Grant
• Numbers vary considerably from field to field.
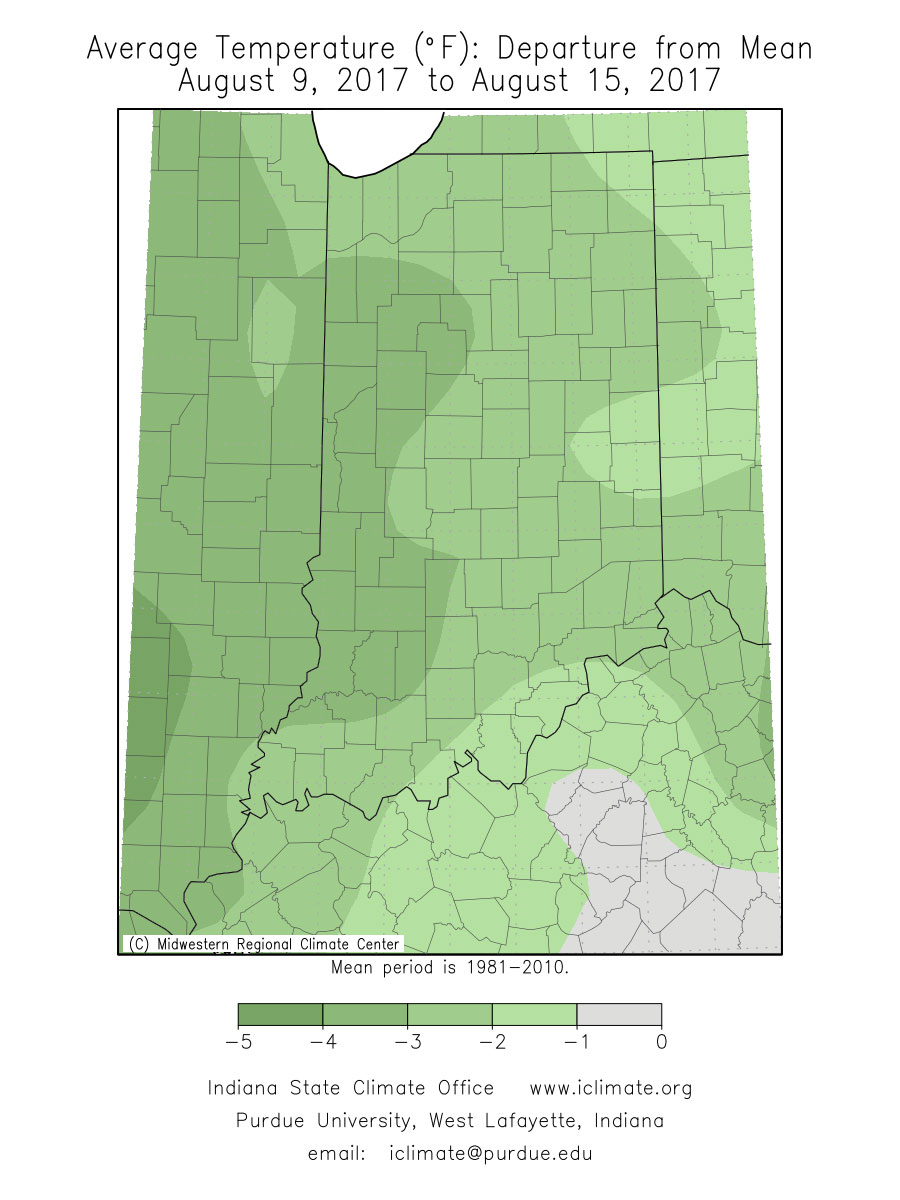
• Recent cooler temperatures favored aphid development.
• Treatment threshold and application guidelines given below.
Soybean aphids have begun to show up in a few northern Indiana soybean fields, some are reportedly over threshold. Because of the tremendous variability in aphid numbers from field to field, diligent scouting NOW can pay big dividends. Aphids are relatively easy to scout for, identify and (for now at least) can be readily controlled using a variety of relatively inexpensive insecticides. The following is a quick scouting review:
Sampling: Count aphids, primarily on the undersides of leaves, on at least 20 plants (the more, the better) in various areas of the field. When aphids are just beginning to colonize soybean plants, they will be concentrated on the most active growing points – the newest unrolled leaves and the developing pods.
Aphid Number: Should you find an average of 250 or more aphids/plant during the early soybean reproductive stages (R1-R4), a treatment is justified. One quick shortcut: seeing aphids on the stem typically indicates that there are more than 250 aphids present. Refer to the following treatment guide. The established threshold of ≥ 250 aphids/plant includes a buffer time of about a week to get the field sprayed. In other words, damage is not occurring at 250 aphids/plant. During the seed-fill stages (R5-R6), treatment is not as clear-cut. If aphid numbers are increasing and plants are under stress a treatment is justified. This usually occurs when dry soil conditions are prevalent. Do NOT treat soybean beyond the R6 stage of growth – there is no advantage in terms yield preservation!
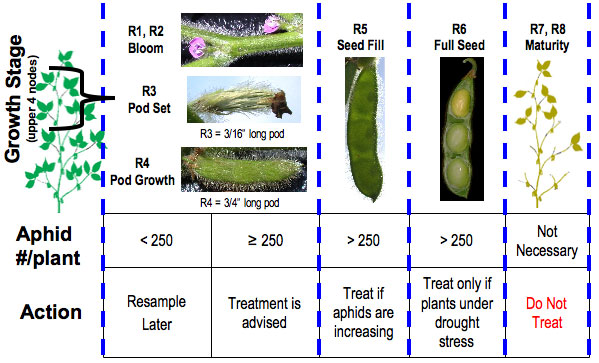
Soybean aphid treatment threshold guide.
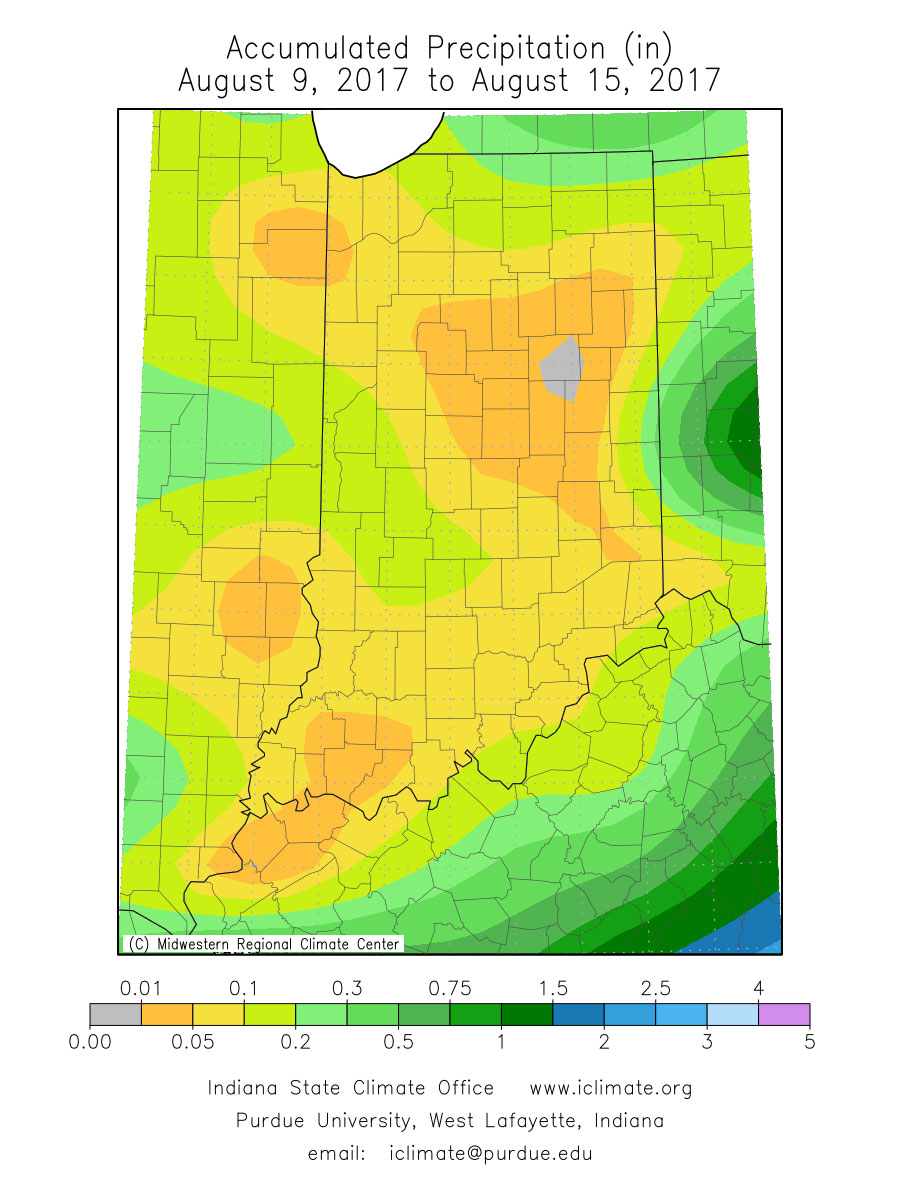
Weather: The temperatures (upper 70’s to low 80’s) we experienced up till a few days ago were optimal for aphid development and reproduction. Rainfall, including some hard downpours, will have some negative effect on aphid populations, but does not wipe them out. This year’s weather has been as favorable as any summer in years for aphid outbreaks.
Treatment: Should control be necessary, complete coverage on the foliage is the key. Ground driven rigs applying at least 20 gallons per acre with 40 PSI with fine droplets will help penetrate the canopy. Finer droplets are desirable when spraying any insecticide on soybeans, and ground application is usually a better approach for canopy penetration. Aerial application success is dependent on finished spray volume (we recommend 5 gallon/acre) and air movement into the canopy.
Products labeled for soybean aphid control can be viewed by clicking HERE
In recent weeks, fall armyworm infestations have been decimating some forage crops. The University of Kentucky Extension Entomologists, have recently reported in their Pest News of large populations of fall armyworm (FAW) moth captures. This indicates, that though one local population may have completed feeding, there are more to come. Just like a very similar species, the armyworm, the behavior is much the same in that they can consume large amounts of foliage as they move enmasse.
Those with late season crops should be inspecting for feeding damage. This is very important for newly-seeded forages. Fall armyworm feed on both grass and broadleaf plants, so alfalfa and the many cover crops getting established should be scouted now and until frost. You have been warned, when the worms are about an inch long, the can denude plants “over night” when they are “marching.”
Products labeled for insect control in alfalfa can be viewed by clicking HERE
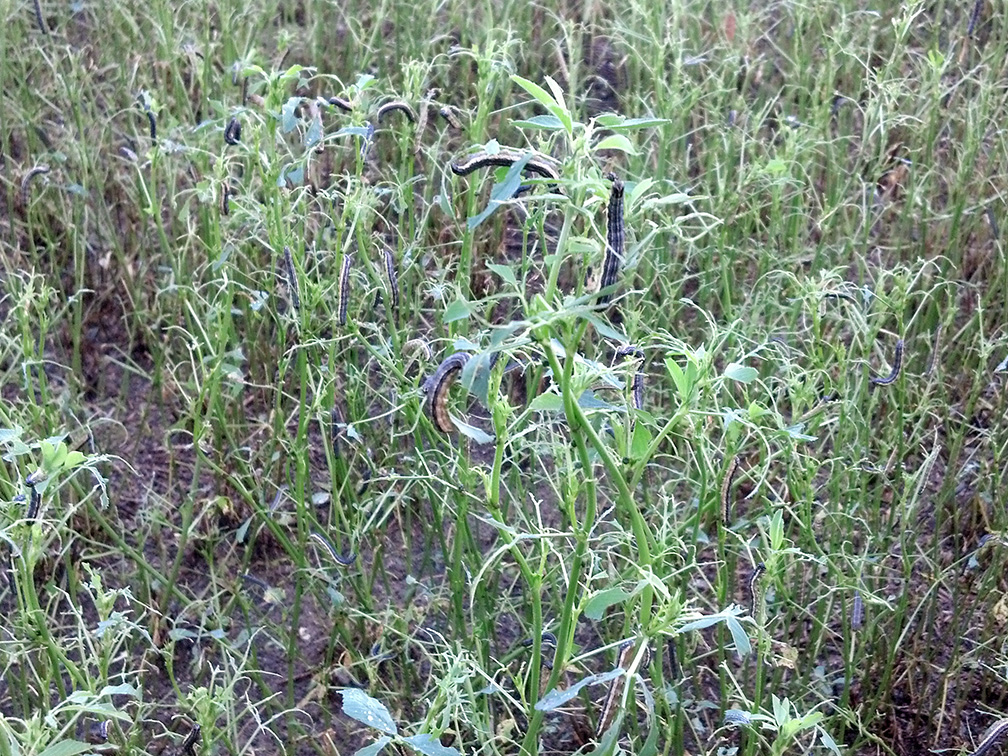
Fall armyworms feeding on alfalfa plants.
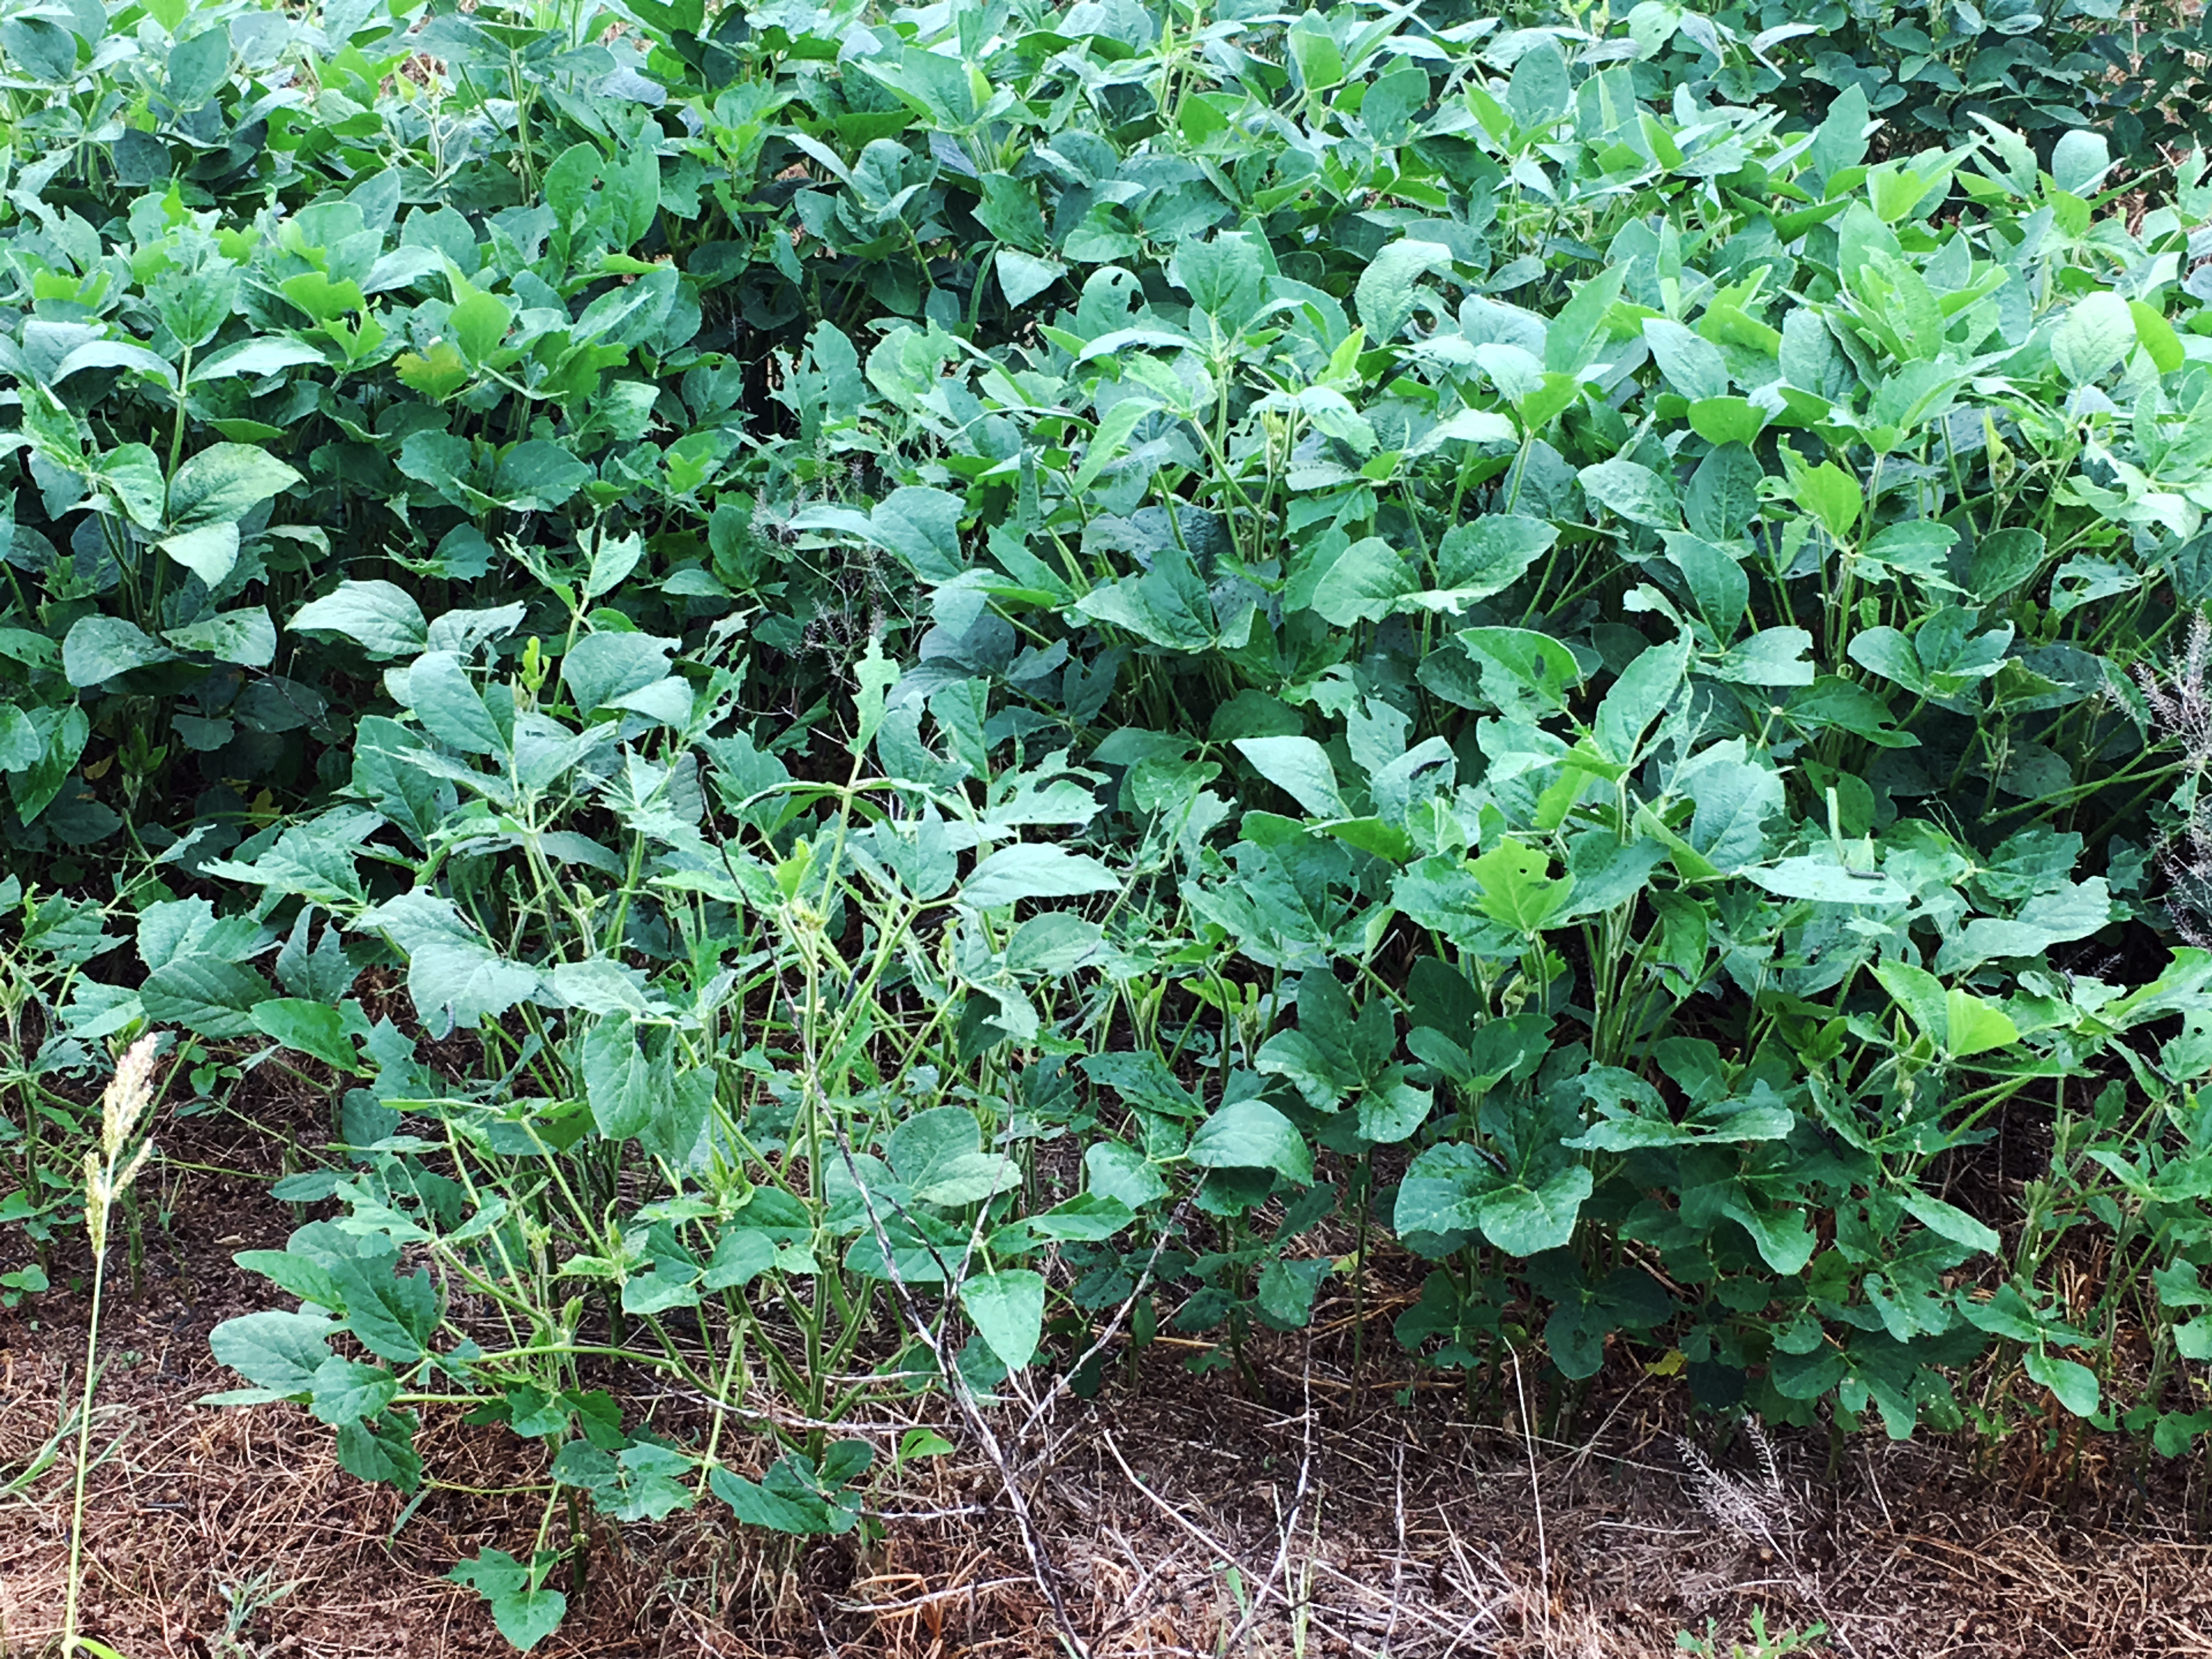
After denuding the alfalfa, the worms moved into the adjoining soybean field (Photo Credit: Luis Santiago).
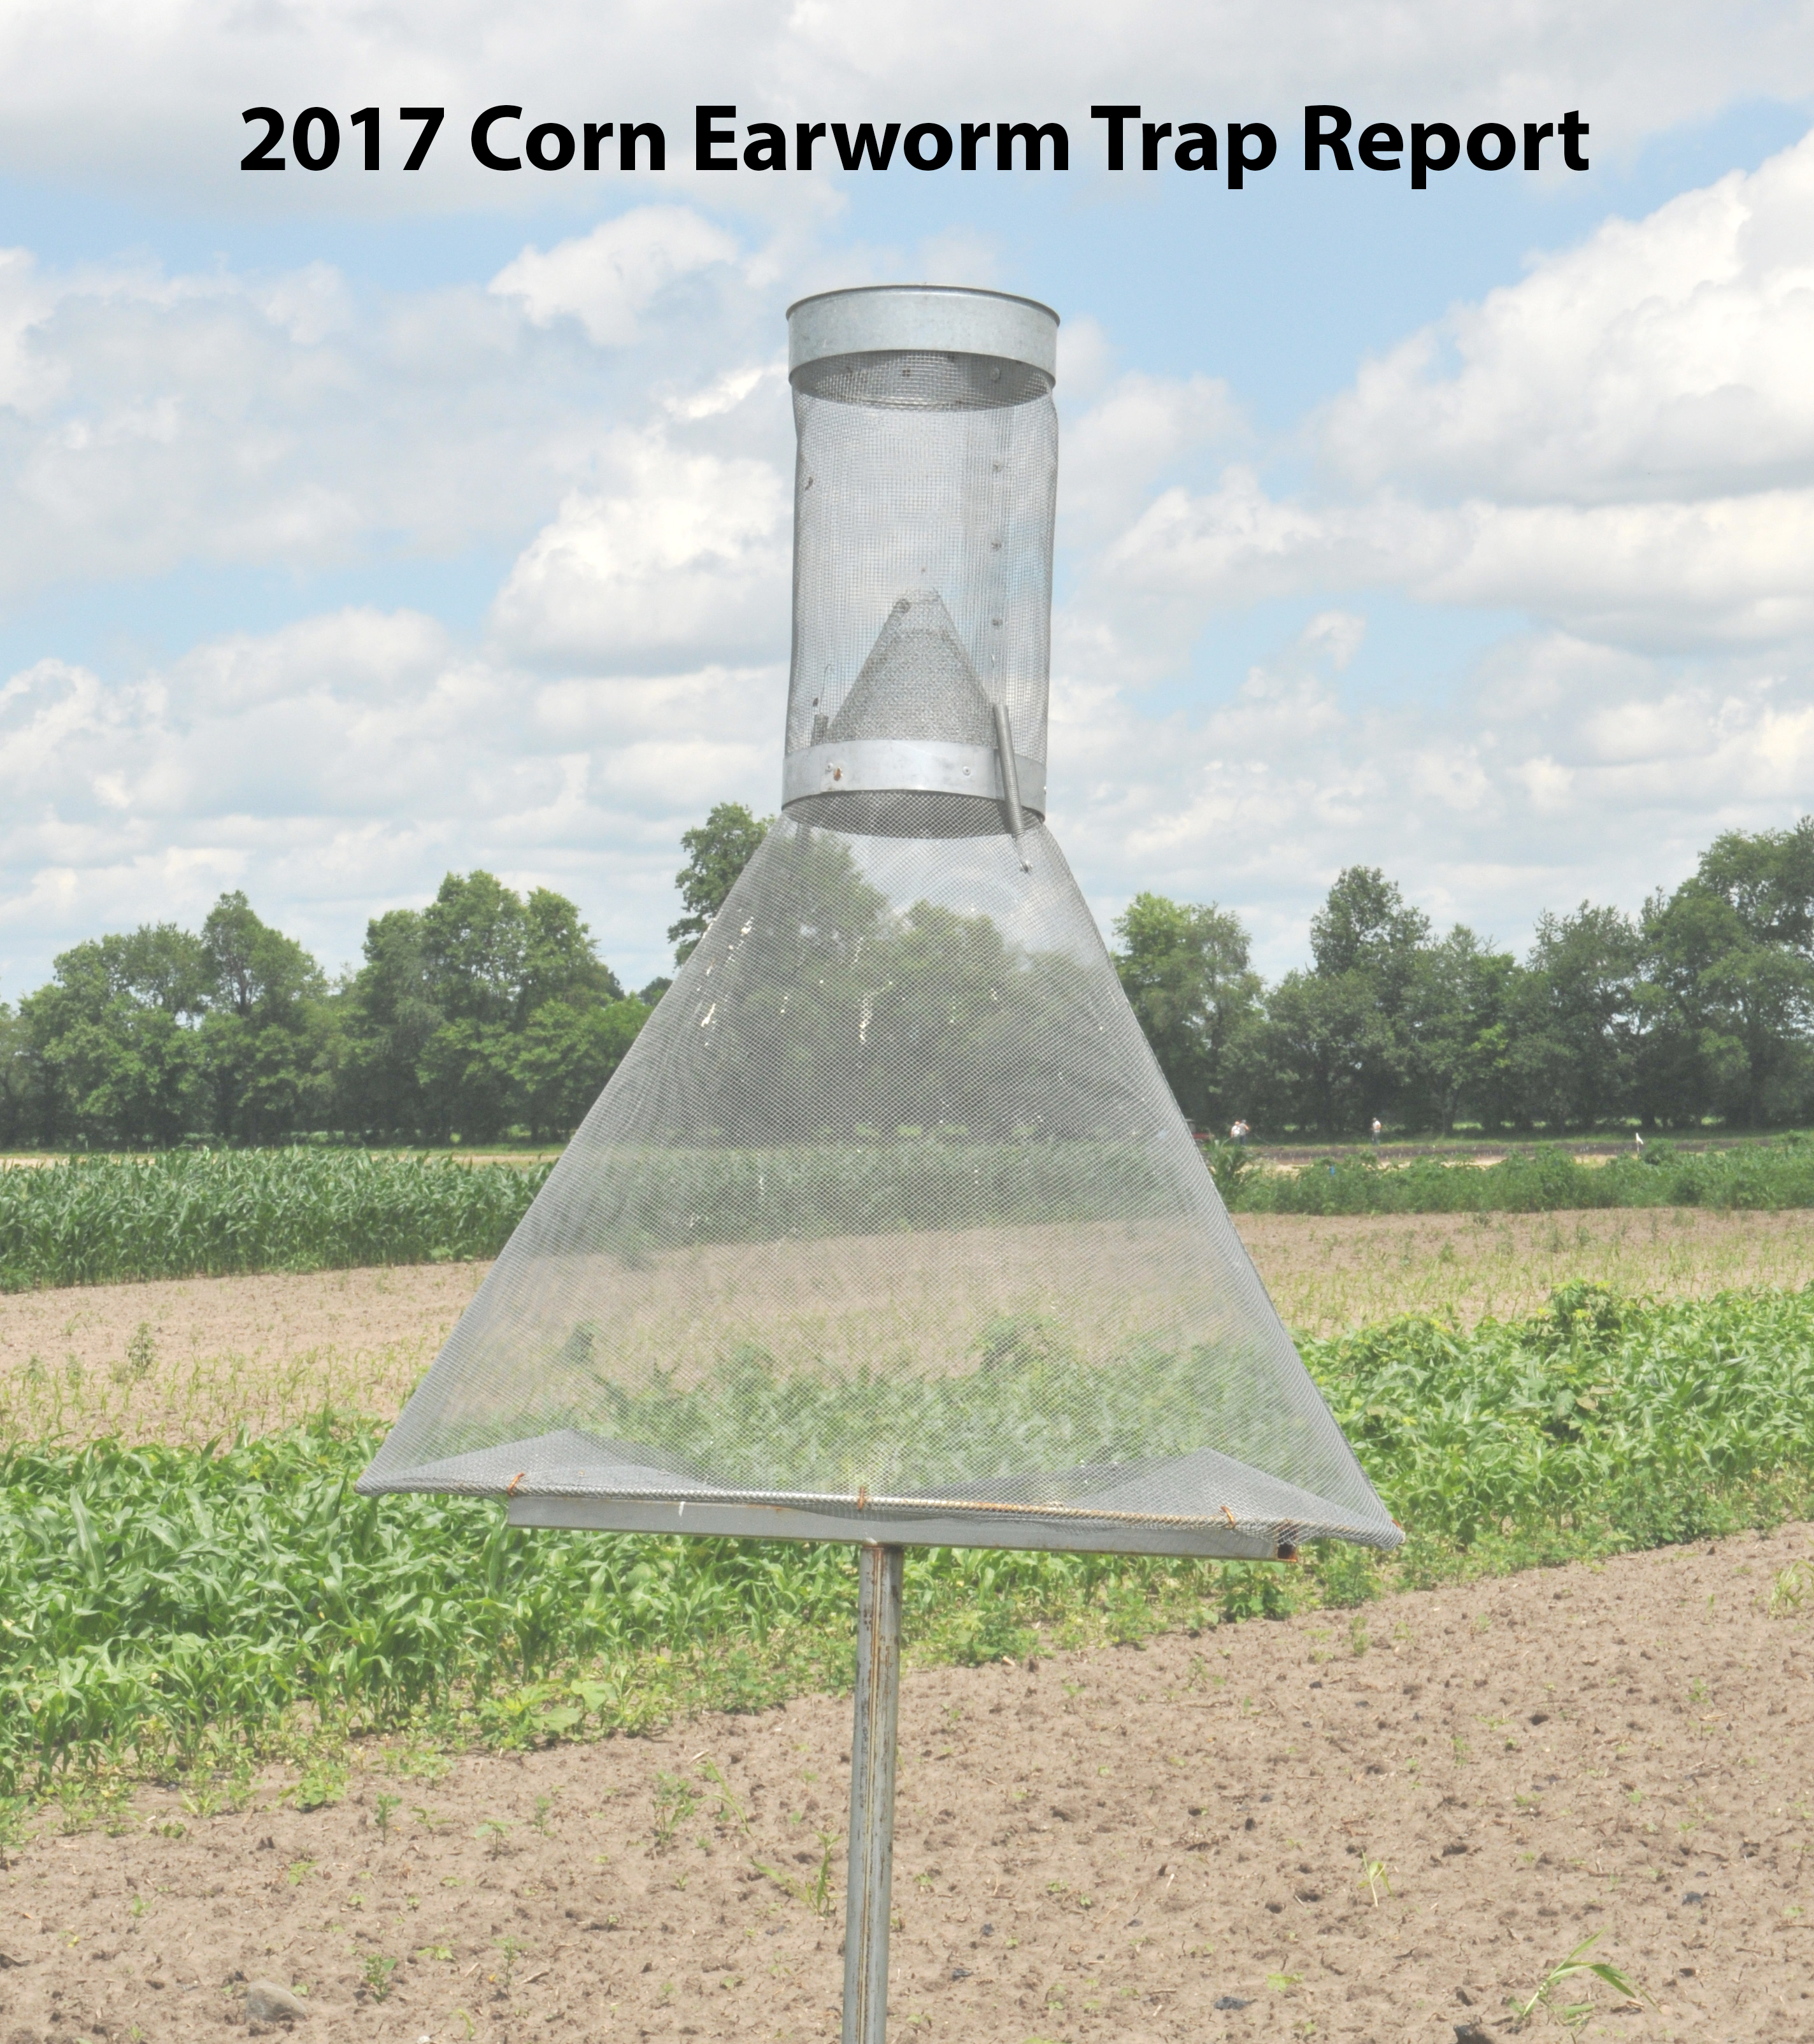
Corn Earworm Trap Report
One of our biggest weed problems across Indiana every year is control of marestail in soybeans, and 2017 has been no different. Many growers had a lot of trouble controlling marestail in their spring burndown programs in April and May. There were two distinct times this spring when our phone lines and emails lit up with questions about poor marestail control. First, we had two heavy frost events on April 8th and 9th, and a lot of fields that got sprayed those days and the following one to two days experienced poor control of marestail. Plants that receive frost damage will slow or shut down their growth for a few days until warmer temperatures and better growing conditions return. We will get our best weed control with systemic herbicides such as glyphosate, 2,4-D, or dicamba when these weeds are actively growing. Many of the fields that were sprayed saw poor results due to using these systemic herbicides on marestail that was not actively growing while plants were trying to recover from the frost events. In many cases, waiting an extra day or two until daytime temperatures were in the 50’s would have helped increase marestail control. The second wave of questions rolled in after the heavy rain and cold temperatures in early May gave way to sunny and warm days that finally allowed equipment traffic in many fields. By this point marestail was often well over a foot tall, a height that limits the effectiveness of any burndown program. In our minds, the issues this spring highlighted the importance of using a fall applied herbicide program to control marestail and other winter annual weeds.
Marestail
Now is the time to start thinking about fall applied herbicides to control marestail and other winter annual weeds in corn and soybean production. When harvest and post-harvest conditions allow, fall is the best time to control many of these weeds. This is because the weeds are a lot smaller in the fall, and our fall weather tends to be consistently warmer and drier than our variable cool and wet springs. Marestail is controlled effectively by many fall applied programs. Managing this weed with fall applied programs should be strongly considered in areas with known infestations of glyphosate-resistant populations. All of the programs listed below will provide control or suppression of glyphosate-resistant marestail except glyphosate alone. The addition of 2.4-D to these products will greatly increase control of glyphosate-resistant populations.
Dandelion
There are pockets across the state that also deal with heavy infestation of dandelions every year. Dandelions are controlled much more effectively with fall applied programs than with spring applied herbicides. All programs listed will provide control or suppression of dandelion. The key in most of the programs is the use of 2,4-D or glyphosate. Control of dandelion with 2,4-D is rate responsive. If dandelion infestations warrant fall treatment, use 2,4-D alone or with the other products at 1 qt/A unless you are using Canopy XL. If using Canopy XL, then the 2,4-D rate can be reduced to 1 pt/A. Glyphosate is much more effective on dandelion in the fall than in the spring. Use 22 oz/A of Roundup Powermax, or 32 oz/A of the other 3 lb acid equivalent/gallon formulations.
Other Winter Annual Weeds
In addition to marestail and dandelion, the other most common winter annual weeds found in Indiana are henbit, purple deadnettle, chickweed, and cressleaf groundsel. In Table 1, we have listed the commercially available programs that have provided 80% or more control of these weeds in University research trials. Most of the commercially available programs offer flexibility in growing either corn or soybean in the following cropping season. This is because their rotational intervals on the label are shorter than the time frame between a fall application and traditional planting dates in April and May of the following year. Specific programs mentioned below that do not offer crop rotation flexibility include Canopy XL (must grow soybean in 2018), and Princep or simazine (must grow only corn in 2018).
Application Timing and Treatments
Fall applied herbicide treatments can be applied from mid October until early December. Products that do not have appreciable residual activity in soil (glyphosate, 2,4-D, Gramoxone alone) should be applied late enough so that weed reemergence after application is minimal. However, foliar activity with these products is better when applications are made during a period of several days of daytime air temperatures of 50 degrees or greater. The addition of metribuzin to these burndown programs will provide an additional 2 to 4 weeks of residual activity in the fall. This added residual from metribuzin is especially beneficial in fields with high populations of marestail. For dandelion control, applications should be about the time of the 1st killing frost (typically late October to early November). Products with residual activity in the soil have more flexibility in application timing and can be applied as soon as the crop is removed from the field.
Table 1. Weed Response to “Burndown” Herbicides (Fall & Spring Application)
This table gives a general comparative rating of “burndown” herbicides used in no-till corn and/or soybean production. Under unfavorable conditions, some herbicides may not perform as well as indicated below. Under very favorable conditions, control may be better than indicated. Herbicide rate, weed size and stage of growth, and environmental conditions interact to influence herbi- cide performance.
Weed control rating: 9 = 90% to 100%; 8 = 80% to 90%; 7 = 70% to 80%; 6 = 60% to 70% control; and - = less than 60% control, not recommended.
Ratings are for control of existing vegetation only (not residual control). Treatments containing glyphosate should be applied with AMS (and surfactant if required by the glyphosate product label). Most other treatments should be applied with a COC or MSO (plus UAN if recommended by the label). Ratings for 2,4-D are based on a rate of 0.5 lb ae/A unless otherwise indicated - increasing the 2,4-D rate to 1.0 lb ae/A will improve control of legumes, dandelion, marestail, and some other weeds.
| HERBICIDE | Giant Foxtail | Lambs- quarters |
Common Ragweed | Giant Ragweed | Annual Smart- weeds |
Common chickweed | Mustards, Shepherd's-purse | Winter Wheat, Rye Cover | Orchard- grass/ Fescue Sod |
Canada Thistle | Red Clover | Alfalfa | Hairy Vetch | Marestail (group 9-R)1 | Prickly Lettuce | Annual Bluegrass | Dead- nettle, henbit |
Carolina Foxtail | Dandelion | Cressleaf groundsel |
|---|---|---|---|---|---|---|---|---|---|---|---|---|---|---|---|---|---|---|---|---|
| 2,4-D (0.5 lb/1.0 lb) | - | - | - | - | - | - | 9 | - | - | -/6 | 6/8 | -/7 | 6/8 | 8/9 | 8/9 | - | -/7 | - | 7/8 | 9/9 |
| 2,4-D + dicamba | - | - | - | - | - | 7 | 9 | - | - | 7 | 9 | 8 | 9 | 9 | 9 | - | 7 | - | 8 | 9 |
| Autumn Super + glyphosate | - | - | - | - | - | 9 | 9 | - | - | - | 6 | - | 6 | 9 | 9 | 9 | 9 | 9 | 8 | 9 |
| Basis/Harrow + 2,4-D | - | - | - | - | - | 9 | 9 | - | - | 6 | 6 | - | 6 | 9 | 9 | 9 | 8+ | 9 | 8 | 9 |
| Chlorimuron2 + 2,4-D | - | - | - | - | - | 7 | 9 | - | - | - | 6 | - | 6 | 9 | 9 | 9 | 9 | - | 9 | 9 |
| CanopyEX/CloakEX + 2,4-D | - | - | - | - | - | 9 | 9 | - | - | - | 6 | - | 6 | 9 | 9 | 9 | 9 | - | 9 | 9 |
| Tribenuron4 + 2,4-D (1.0 lb) | - | - | - | - | - | 9 | 9 | - | - | 6 | 6 | - | 6 | 9 | 9 | - | 8 | - | 7 | 9 |
| Glyphosate | - | - | - | - | - | 9 | 9 | 9 | 9 | 9 | 8 | 8 | 8 | - | 8 | 9 | 8 | 9 | 8 | 9 |
| Glyphosate + 2,4-D | - | - | - | - | - | 9 | 9 | 9 | 8 | 8 | 9 | 9 | 9 | 9 | 9 | 9 | 9 | 9 | 8 | 9 |
| Glyphosate + Sharpen | - | - | - | - | - | 9 | 9 | 8 | 8 | 8 | 7 | 7 | 7 | 9 | 9 | 9 | 8 | 8 | 7 | 9 |
| Metribuzin/Authority MTZ + 2,4-D | - | - | - | - | - | 7+ | 9 | - | - | - | - | - | 6 | 9 | 9 | - | 9 | 7 | 7 | 9 |
| Simazine + 2,4-D | - | - | - | - | - | 9 | 9 | - | - | - | - | - | 6 | 9 | 9 | 8 | 8+ | 8 | 7 | 9 |
Fancy colored yield maps are fine for verifying grain yields at the end of the harvest season, but bragging rights for the highest corn yields are established earlier than that down at the Main Street Cafe, on the corner of 5th and Earl. Some patrons of the cafe begin "eyeballing" their yields as soon as their crops reach "roasting ear" stage. Some of the guys there are pretty good (or just plain lucky) at estimating yields prior to harvest, while the estimates by others are not even close to being within the proverbial ballpark. Interestingly, they all use the same procedure referred to as the Yield Component Method.
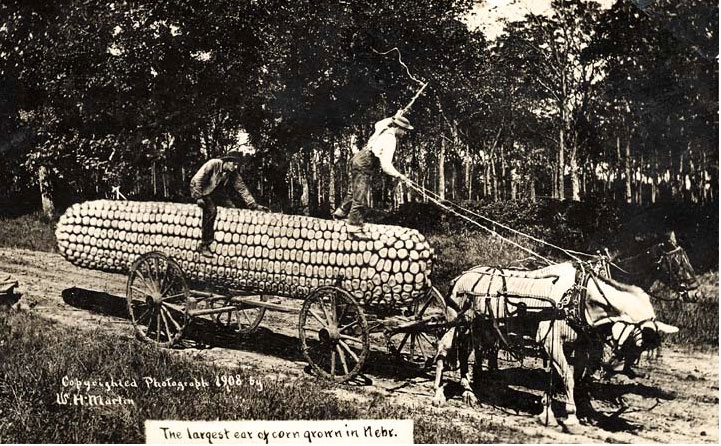
Largest ear of corn in Nebraska, ca. 1908. (Courtesy of the Nebr. Historical Society).
Other pre-harvest yield prediction methods exist (Lauer, 2002; Lee & Herbek, 2005; Thomison, 2015), but the Yield Component Method is probably the most popular because it can be used well ahead of harvest; as early as the so-called "roasting ear" or milk (R3) stage of kernel development. Under “normal” conditions, the kernel milk stage occurs about 18 to 22 days after pollination is complete (Nielsen, 2016). Estimates made earlier in the kernel development period risk being overly optimistic if subsequent severe stresses cause unforeseen kernel abortion (Nielsen, 2013).
The Yield Component Method was originally described by the University of Illinois many years ago and is based on the premise that one can estimate grain yield from estimates of the yield components that constitute grain yield. These yield components include number of ears per acre, number of kernel rows per ear, number of kernels per row, and weight per kernel. The first three yield components (ear number, kernel rows, kernels/row) are easily measured in the field.
Final weight per kernel obviously cannot be measured until the grain is mature (kernel black layer) and, technically, at a grain moisture of 15% since that is the typical moisture value used to determine a 56-lb market bushel. Consequently, an average value for kernel weight is used as a proverbial "fudge factor" in the yield estimation equation. As first described many years ago, the equation originally used a "fudge factor" of 90, which represented 90,000 kernels per 56-lb bushel. In terms of how kernel weight is usually measured in research, this would be equal to about 282 grams per 1000 kernels.
Be aware that actual kernel numbers per 56-lb bushel among years or fields within years can vary significantly and is influenced by both growing conditions and hybrid genetics. Kernel weight among hybrids can easily vary from less than 65,000 kernels per 56-lb bushel to more than 100,000 kernels per 56-lb bushel. Kernel weight from year to year for the same hybrid can easily vary by 20,000 kernels per bushel or more simply due to variability in growing conditions during the grain filling period.
Crop uniformity also influences the accuracy of any yield estimation technique. The less uniform the field, the greater the number of samples that should be taken to estimate yield for the field. There is a fine line between fairly sampling disparate areas of the field and sampling randomly within a field so as not to unfairly bias the yield estimates up or down.
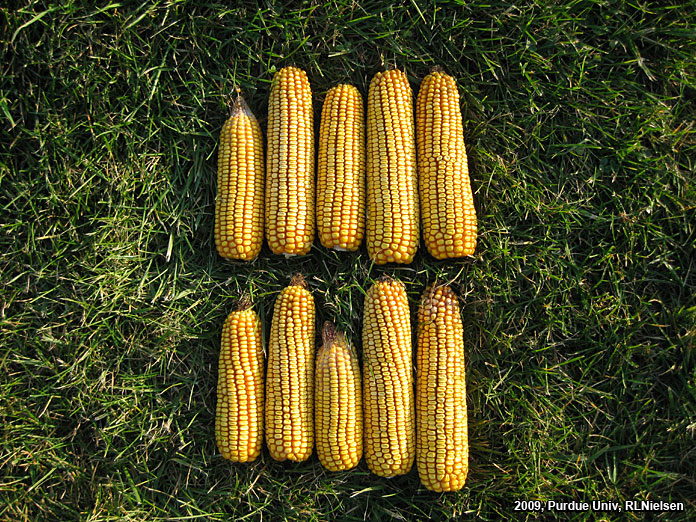
Random sample of ears.
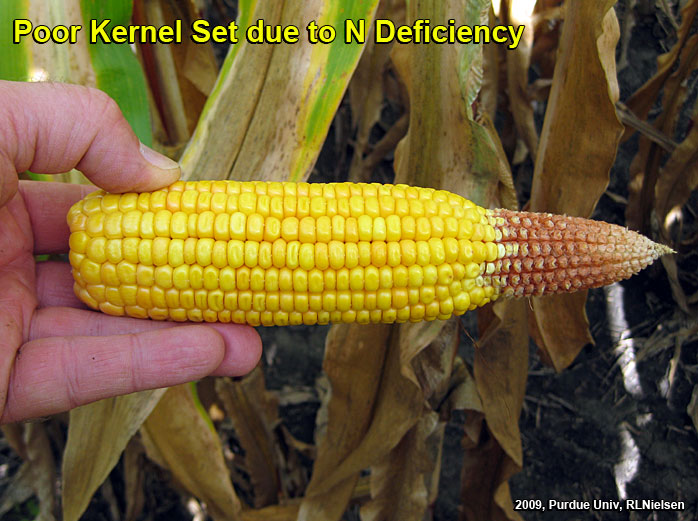
Poor tip fill due to N deficiency.
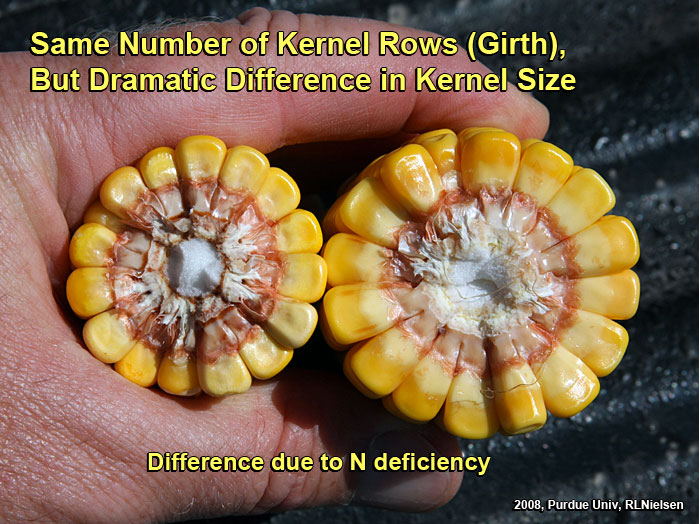
Same number of kernel rows (girth), but dramatic difference in kernel size.
Remember that this method for estimating pre-harvest grain yield in corn indeed provides only an estimate. Since kernel size and weight will vary depending on hybrid and environment, this yield estimator should only be used to determine “ballpark” grain yields. Yield can easily be overestimated in a year with poor grain fill conditions (e.g., low kernel size and weight from a drought year) and underestimated in a year with excellent grain fill conditions (e.g., larger kernel size and weight from non-stress grain fill periods). The closer to kernel black layer stage you sample, the more accurately you can "guesstimate" whether kernel weight will be above or below average for this year.
Recognize that the Yield Component Method for estimating corn grain yield is probably only accurate within plus or minus 20 bushels of the actual yield. Obviously, the more ears you sample within a field, the more accurately you will "capture" the variability of yield throughout the field. Use the yield estimates obtained by this method for general planning purposes only.
There are a number of apps available for download to your smart phone or mobile tablet that can be used to simplify the calculations of the Yield Component Method. Some crop scouting apps include grain yield estimators as one of their features. Be sure to thoroughly test the calculations of any app you choose to use on your phone to ensure that the math is correct. Some offer multiple kernel "fudge factors", but do not literally specify what kernel numbers per 56-lb bushel they use. Some only allow you to sample 3 ears at a time. Most do not allow you to sample AND save the results of multiple sites within a field or multiple fields in an operation. As the old adage says... "Buyer beware!"
This curmudgeon prefers to do the math the old-fashioned way... with my smart phone calculator and a note pad.
The Pro Farmer division of Farm Journal Media sponsors an annual Midwest Crop Tour that sends out teams of "scouts" to visit corn fields throughout the Midwest to estimate yields. The method used in that effort is a variation of one described years ago by University of Minnesota agronomist Dale Hicks (now Professor Emeritus) that combines the use of several yield components (ears per acre and kernel rows per ear) with a measurement of ear length (a proxy for kernel number per row).
The focus of the crop tour is not to necessarily estimate the yields of specific fields, but rather to more broadly estimate the yield potential within regions of the Midwest, so one probably should exercise caution in using this method for estimating yields within an individual field. Nevertheless, folks who have heard about the Pro Farmer Tour may be interested in trying the method themselves, so here are the steps involved with the Pro Farmer method (Flory, 2010; Mick, 2013). I would certainly suggest that these steps be repeated in several areas of an individual field because of natural spatial variability for yield.
Flory, Chip. 2010. Crop Tour Insider. Pro Farmer, Farm Journal Media. [Originally online, but no longer accessible. See Mick, 2013].
Lauer, Joe. 2002. Methods for Calculating Corn Yield. Agronomy Advice, Univ. of Wisconsin-Madison. Online at http://corn.agronomy.wisc.edu/AA/pdfs/A033.pdf [URL accessed Aug 2017].
Lee, Chad and Jim Herbek. 2005. Estimating Corn Yields (AGR-187). Univ. of Kentucky. Online at http://www.ca.uky.edu/agc/pubs/agr/agr187/agr187.pdf. [URL accessed Aug 2017].
Mick, Katie. 2013. How the Crop Tour Arrives at Yield Estimates. DTN/Progressive Farmer. http://goo.gl/ADmbYt [URL accessed Aug 2017].
Nielsen, R.L. (Bob). 2017. Kernel Set Scuttlebutt. Corny News Network, Purdue Univ. Online at http://www.kingcorn.org/news/timeless/KernelSet.html [URL accessed Aug 2017].
Nielsen, RL (Bob). 2012. Opportunities to Assess Yield Potential of Drought-Stressed Corn. Corny News Network, Purdue Extension. Online at http://www.kingcorn.org/news/articles.12/YldAssessment-0727.html [URL accessed Aug 2017].
Nielsen, R.L. (Bob). 2013. Effects of Stress During Grain Filling in Corn. Corny News Network, Purdue Univ. Online at http://www.kingcorn.org/news/timeless/GrainFillStress.html [URL accessed Aug 2017].
Nielsen, R.L. (Bob). 2016. Grain Fill Stages in Corn. Corny News Network, Purdue Univ. Online at http://www.kingcorn.org/news/timeless/GrainFill.html [URL accessed Aug 2017].
Thomison, Peter. 2015. Estimating Corn Yields . C.O.R.N. Newsletter, Ohio State Univ. Online at http://agcrops.osu.edu/newsletter/corn-newsletter/2015-25/estimating-corn-yields [URL accessed Aug 2017].
Understand this one simple fact about grain yield monitors: They do not measure grain yield.
How's that for an opening statement?
What I want you to understand is that yield monitors ESTIMATE yield by converting electrical signals received from a mass impact or optical sensor, located somewhere in the clean grain elevator of the combine, into ESTIMATES of grain flow (lbs) per second or two of travel time. Along with ESTIMATES of distance traveled (usually based on differentially corrected GPS signals), header width, and ESTIMATES of grain moisture content... the yield monitor's firmware / software then ESTIMATES "dry" grain yield per acre, at a moisture content of your choice, and records those yield estimates, and their geographic location in the field, every second or two in the display's memory or uploaded by cellular connection to a Cloud-based Web server.
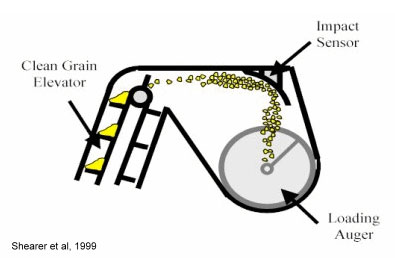
Yield monitor.
Yield monitor calibration involves a series of steps to ensure that the ESTIMATION of each of these factors is accurate. One of those steps involves the harvesting of calibration "loads" of grain that are used to "teach" the yield monitor's "black box" how to accurately convert the electrical signals from the sensors into ESTIMATES of grain flow rates.
The calibration "loads" should be harvested in such a way as to mimic the range of grain flow rates (i.e., the range of yield) you expect to encounter when harvesting a field. Ideally, each calibration load is calibrated at a different, but uniform grain flow rate. Some folks harvest strips at different speeds to accomplish this. Some folks harvest strips of varying widths (full header, 3/4 header, 1/2 header, etc.). In our field-scale nitrogen research trials where we have a wide range of N rate strips, our calibration loads typically come from 5 to 6 different N treatment rates because that often provides the greatest range of potential grain flow rates.
Yield estimates on a whole field or individual load basis made by a well-calibrated yield monitor are accurate in the sense that they often very closely match yield estimates calculated from weigh wagons or commercial weigh scales. However, to achieve a satisfactory level of accuracy, yield monitors must be "trained" to correctly interpret the electrical signals created by the impact sensor into estimates of grain flow rate . Some background information may help you better understand the nature of and importance of faithfully and regularly calibrating yield monitors.
Calibrating a yield monitor simply requires the harvest of individual "loads" of grain that represent the range of grain flow rates (i.e., a range of yield levels) expected in the field(s) to be harvested.The amount of grain required for each calibration "load" ranges from 3,000 to 6,000 lbs (50 to 100 bu grain) depending on the manufacturer's recommendations for the specific model/make of yield monitor. The grain weight of each "load" is estimated "on the go" by the yield monitor as the grain is harvested. The grain for that specific "load" is then offloaded from the combine hopper and weighed on calibrated or "known to be accurate" weigh wagon or commercial scales. The actual weight is then entered into the yield monitor console and the yield monitor firmware makes mathematical adjustments to the calibration response curve.
Conceptually, the calibration process involves fitting a response curve between grain flow rate and flow sensor signal strength in order to estimate low, medium, and high yields. Makes of monitors appear to differ in the nature of the calibration curve that is determined.
Some manufacturers suggest that only one grain load is necessary to perform an accurate calibration. That recommendation implies the calibration response curve is a straight-line or near-linear relationship between grain flow rates and flow sensor signals. While the standard recommendation is for only one grain load, the "fine print" in the owners' manual suggests that additional calibration loads may be added to fine-tune the accuracy when necessary.
Other manufacturers recommend between 3 and 6 grain loads are required to perform a satisfactory calibration of the yield monitor. This recommendation suggests that the calibration response curve for these yield monitors is not a straight-line, but is rather some sort of non-linear response curve that requires a number of calibration points to best "train" the yield monitor how to interpret the flow sensor signals.
The goal with multi-load calibration procedures is to "capture" the full range of grain flow rates (aka yield levels) you expect to encounter during the harvest of your fields. Capturing a range of grain flow rates during calibration can be a nuisance because it typically requires harvesting individual full header-width "loads" at different speeds or partial header-width "loads" at a constant speed. This headache plus the time it takes to off-load and weigh the individual grain loads are among the most common reasons why growers do not faithfully or routinely calibrate their yield monitors.
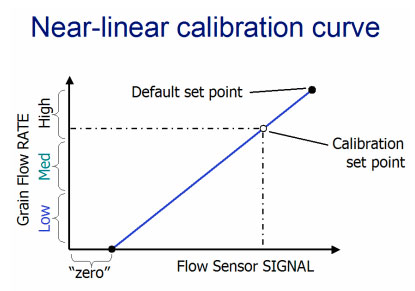
Near-linear calibration curve.
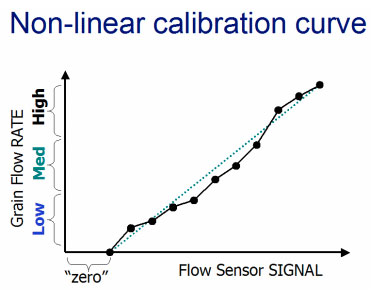
Non-linear calibration curve.
Yield monitor accuracy can be excellent if the yield monitor is well-calibrated. Yield estimates by calibrated yield monitors that I use in my field-scale research trials are typically within 1 % or less of the actual grain weight measured with a weigh wagon or farm scales. Conversely, yield estimates can be very poor if yield monitors are not well-calibrated. The error in accuracy can be as much as 100 % if the yield monitor is taken "off the shelf" and put into service without any calibration. Errors in accuracy can easily range as high as 7 to 10 % late in harvest season if the yield monitor was calibrated only at the beginning of the harvest season because of changes in grain moisture content. Errors in yield estimates are especially likely if the full anticipated range of harvested grain flow rates are not included in the calibration of the yield monitor.
Well, you may ask... who cares whether or not your yield monitor is providing you with accurate yield estimates? After all, growers are typically paid at the point of sale according to the net grain weights printed on the scale ticket and not according to a yield map. Quite honestly, accurate yield monitor estimates also may not matter for simple farm record-keeping purposes.
However, if you want to USE the information that an accurate yield dataset provides, then you should strive to ensure accuracy in the yield estimates made by your yield monitor. Common uses for yield monitor data include comparisons of one field to another, one specific spot in a field to another, one hybrid's performance to another, early versus late harvest season, and experimental treatments in on-farm field trials.
Yield monitor calibration accuracy can be influenced by yield levels outside the range of grain flow rates used for the yield monitor calibration, by seasonal changes in temperature, by seasonal changes in grain moisture content, by hybrids in terms of their differences for grain weight, grain shape, and grain moisture, and by field topography. Calibrating your yield monitor once a season will not assure that it remains accurate the entire season. Check the accuracy of the yield monitor calibration occasionally by harvesting and weighing additional calibration loads. Recalibrate the yield monitor when necessary to maintain an acceptable accuracy.
Yield data can be very useful for identifying and diagnosing yield influencing factors in corn or soybean. Yield monitors can also be useful for harvesting on-farm research trials. Yield monitor calibration, yield data processing, and yield data "cleaning" are necessary to ensure accurate yield data.
The bottom line is that extra care and attention to details are important when calibrating yield monitors. Dig out that users guide for your yield monitor system NOW. Before the end of summer, devote some quality time to reading the sections on yield monitor calibration. Familiarize yourself with all aspects of yield monitor calibration. Attend a yield monitor workshop. Create your own checklist of calibration steps and follow them faithfully every time you calibrate the monitor. Do not forget the little things like vibration settings, header height stops, offset of the DGPS antenna, etc. Recognize that accurate weighing devices (grain carts, weigh wagons, farm scales) and moisture meters are crucial for the calibration of the monitor's wet weight estimates and adjusting the combine's moisture sensor readings.
And remember the old adage about computers: "Garbage in equals garbage out".
AgLeader Technology. 2017. Manuals / Guides / Schematics. [online ] https://support.agleader.com/kbp/index.php?CategoryID=290. [URL accessed Aug 2017].
AgLeader Technology. 2017. Yield Monitoring. https://support.agleader.com/kbp/index.php?View=afile&EntryID=1543&AttachID=2981. [URL accessed Aug 2017].
Colvin, T.S. and S. Arslan. 1999. Yield Monitor Accuracy. Potash and Phosphate Institute Publ. SSMG-9. [URL accessed Aug 2017].
Darr, Matt and DuPont Pioneer. Yield Monitor Systems: A Pocket Guide. DuPont Pioneer and Iowa State Univ. https://www.pioneer.com/CMRoot/pioneer/us/agronomy/ympocketguide.pdf. [URL accessed Aug 2017].
Hawkins, Elizabeth, John Fulton, and Kaylee Port. 2017. Tips for Calibrating Grain Yield Monitors - Maximizing Value of Your Yield Data. Ohioline. Ohio State Univ Extension. https://ohioline.osu.edu/factsheet/anr-8. [URL accessed Aug 2017].
Hest, David. 2015. Calibrate yield monitors more often. Corn and Soybean Digest, Penton. http://cornandsoybeandigest.com/corn/calibrate-yield-monitors-more-often [URL accessed Aug 2017].
John Deere. 2017. Yield Calibration Procedure for S-Series Combines. https://www.deere.com/en_US/docs/pdfs/brochures/YieldCalibration-English.pdf. [URL accessed Aug 2017].
Luck, Joe and John Fulton. 2014. Best Management Practices for Collecting Accurate Yield Data and Avoiding Errors During Harvest. Univ. Nebraska Extension publication EC2004. http://extensionpublications.unl.edu/assets/pdf/ec2004.pdf [URL accessed Aug 2017].
Nielsen, R.L. (Bob). 2014. Wandering Hybrid Syndrome: Yield Monitor Errors. Corny News Network, Purdue Univ. Agronomy Extension. http://www.kingcorn.org/news/timeless/AutoHybridErrors.html. [URL accessed 2017].
Nielsen, R.L. (Bob). 2014. Wandering Swath Width Syndrome: Yield Monitor Errors. Corny News Network, Purdue Univ. Agronomy Extension. http://www.kingcorn.org/news/timeless/AutoHeaderWidth.html. [URL accessed 2017].
Nielsen, R.L. (Bob). 2016. Identify and Eliminate "Gremlins" From Yield Monitor Data. Corny News Network, Purdue Univ. Agronomy Extension. http://www.kingcorn.org/news/timeless/CleaningYieldData.html. [URL accessed 2017].
Precision Planting. 2017. Yield Sense Monitor Operators Guide and How To Docs. https://goo.gl/QiS5Q6 [URL accessed Aug 2017].
Shearer, S.A., J.P. Fulton, S.G. McNeill, S.F. Higgins, and T.G. Mueller. 1999. Elements of Precision Agriculture: Basics of Yield Monitor Installation and Operation. Univ. of Kentucky. http://www2.ca.uky.edu/agcomm/pubs/pa/pa1/pa1.pdf. [URL accessed Aug 2017].
Purdue Cooperative Extension Service
Purdue Extension Entomology
901 W. State Street
West Lafayette, IN, 47907
(765) 494-8761
luck@purdue.edu
@PurdueExtEnt
PurdueEntomology
If you would like to be alerted by e-mail when the current issue of the Pest&Crop is available on-line, please enter your e-mail address and click the submit button.
It is the policy of the Purdue University Cooperative Extension Service that all persons have equal opportunity and access to its educational programs, services, activities, and facilities without regard to race, religion, color, sex, age, national origin or ancestry, marital status, parental status, sexual orientation, disability or status as a veteran. Purdue University is an Affirmative Action institution. This material may be available in alternative formats.