Pest & Crop
Newsletter
Purdue Cooperative Extension Service
Purdue Cooperative Extension Service
Issue 16, July 14, 2017 • USDA-NIFA Extension IPM Grant
| County | Cooperator | WBC Trapped | ||||||
|---|---|---|---|---|---|---|---|---|
| Week 1 6/22/17 - 6/28/17 |
Week 2 6/29/17 - 7/5/17 |
Week 3 |
||||||
| Adams | Kaminsky/New Era Ag | 0 | 6 | 4 | ||||
| Adams | Roe/Mercer Landmark | 0 | 8 | 6 | ||||
| Allen | Anderson/Syngenta Seed | 0 | 4 | 26 | ||||
| Allen | Gynn/Southwind Farms | 0 | 8 | 13 | ||||
| Allen | Kneubuhler/G&K Concepts/Harlan | 0 | 4 | 13 | ||||
| Allen | Kneubuhler/G&K Concepts/Koch | 0 | 10 | 0 | ||||
| Bartholomew | Bush/Pioneer Hybrids | 0 | 0 | 0 | ||||
| Clay | Bower/Ceres Solutions/Clay City | 0 | 0 | |||||
| Clay | Bower/Ceres Solutions/Brazil | 0 | 0 | |||||
| Clinton | Emanuel/Boone Co. CES | 1 | 1 | |||||
| Clinton | Foster/Purdue Entomology | 0 | 0 | 2 | ||||
| DeKalb | Hoffman/ATA Solutions | 87 | ||||||
| Dubois | Eck/Purdue CES | 0 | 1 | 0 | ||||
| Elkhart | Kauffman/Crop Tech Inc. | 35 | 156 | |||||
| Fayette | Schelle/Falmouth Farm Supply Inc. | 1 | 1 | 0 | ||||
| Fountain | Mroczkiewicz/Syngenta | 41 | 31 | 14 | ||||
| Fulton | Jenkins/N. Central Coop/Talma | 379 | 385 | 167 | ||||
| Fulton | Ranstead/N. Central Coop/Rochester | |||||||
| Gibson | Schmitz/Gibson Co. CES | 0 | 0 | |||||
| Hamilton | Campbell/Beck's Hybrids | 3 | 2 | |||||
| Hendricks | Nicholson/Nicholson Consulting | 0 | 1 | 1 | ||||
| Jasper | Overstreet/Purdue CES | 438 | 410 | 304 | ||||
| Jasper | Ritter/Brodbeck Seeds | 302 | 171 | 124 | ||||
| Jay | Boyer/Davis PAC | 5 | 1 | 0 | ||||
| Jay | Shrack/Ran Del Agri Services | 0 | 0 | 0 | ||||
| Jay | Temple/Jay County CES/Pennville | 0 | 1 | 3 | ||||
| Jay | Temple/Jay County CES/Redkey | 3 | 4 | 7 | ||||
| Jennings | Bauerle/SEPAC | 0 | 0 | 0 | ||||
| Knox | Bower/Ceres Solutions/Vincennes | 0 | 0 | |||||
| Knox | Bower/Ceres Solutions/Freelandville | 0 | 0 | |||||
| Kosciusko | Klotz/Etna Green | 75 | 112 | 92 | ||||
| Lake | Kleine/Kleine Farms | 0 | 4 | 41 | ||||
| Lake | Moyer/Dekalb Hybrids, Shelby | 157 | 108 | 63 | ||||
| Lake | Moyer/Dekalb Hybrids, Schneider | 246 | 151 | 101 | ||||
| LaPorte | Rocke/Agri-Mgmt Solutions, Wanatah | 120 | 122 | 321 | ||||
| LaPorte | Smith/Co-Alliance/LaPorte | 0 | 11 | 29 | ||||
| LaPorte | Smith/Co-Alliance/Fish Lake | 6 | 20 | 109 | ||||
| LaPorte | Smith/Co-Alliance/Union Mills | 15 | 19 | 122 | ||||
| LaPorte | Smith/Co-Alliance/LaCrosse | 35 | 149 | 337 | ||||
| Marshall | Harrell/Harrell Ag Services | 4 | 118 | |||||
| Marshall | Klotz/SR 10 & SR 331 | 29 | 81 | 130 | ||||
| Marshall | Miller/North Central Coop | 48 | ||||||
| Miami | Early/Pioneer Hybrids | 189 | 216 | 140 | ||||
| Newton | Moyer/Dekalb Hybrids, Lake Village | 16 | 139 | 262 | ||||
| Porter | Leuck/PPAC | 11 | 17 | 335 | ||||
| Pulaski | Capouch/M&R Ag Services | 42 | 49 | |||||
| Pulaski | Leman/North Central Coop | 4 | 22 | |||||
| Putnam | Nicholson/Nicholson Consulting | 0 | 2 | 0 | ||||
| Randolph | Boyer/DPAC | 2 | 2 | 3 | ||||
| Rush | Schelle/Falmouth Farm Supply Inc. | 0 | 0 | |||||
| Shelby | Fisher/Shelby Co. Co-Op | 0 | 0 | 0 | ||||
| Shelby | Simpson/Simpson Farms | 4 | 5 | 2 | ||||
| Starke | Capouch/M&R Ag Services | 0 | 184 | |||||
| Starke | David Wickert/Wickert Consulting | 5 | 28 | 21 | ||||
| Starke | Larry Wickert/Wickert Consulting | 136 | 292 | 185 | ||||
| St. Joseph | Barry/Helena | 3 | 28 | 108 | ||||
| St. Joseph | Gary Battles | 1 | 12 | 16 | ||||
| St. Joseph | Carbiener/Union Twp. | 0 | 11 | 50 | ||||
| St. Joseph | Smith/Co-Alliance/Granger | 7 | 46 | 87 | ||||
| St. Joseph | Smith/Co-Alliance/New Carlisle | 0 | 3 | 69 | ||||
| Sullivan | Bower/Ceres Solutions/Farmersburg | 0 | 0 | |||||
| Tippecanoe | Bower/Ceres Solutions/Sullivan | 0 | 8 | |||||
| Tippecanoe | Bower/Ceres Solutions/Lafayette | 15 | 25 | |||||
| Tippecanoe | Nagel/Ceres Solutions | 1 | 1 | 6 | ||||
| Tippecanoe | Obermeyer/Purdue Entomology | 0 | 0 | 0 | ||||
| Tippecanoe | Westerfeld/Monsanto | 2 | 3 | 0 | ||||
| Tipton | Campbell/Beck's Hybrids | 0 | 2 | |||||
| Vermillion | Bower/Ceres Solutions/Clinton | 0 | 0 | |||||
| Wabash | Enyeart/North Central Coop | 1 | 10 | 15 | ||||
| Whitley | Richards/NEPAC | 23 | 70 | 39 | ||||
| Whitley | Richards/NEPAC | 182 | ||||||
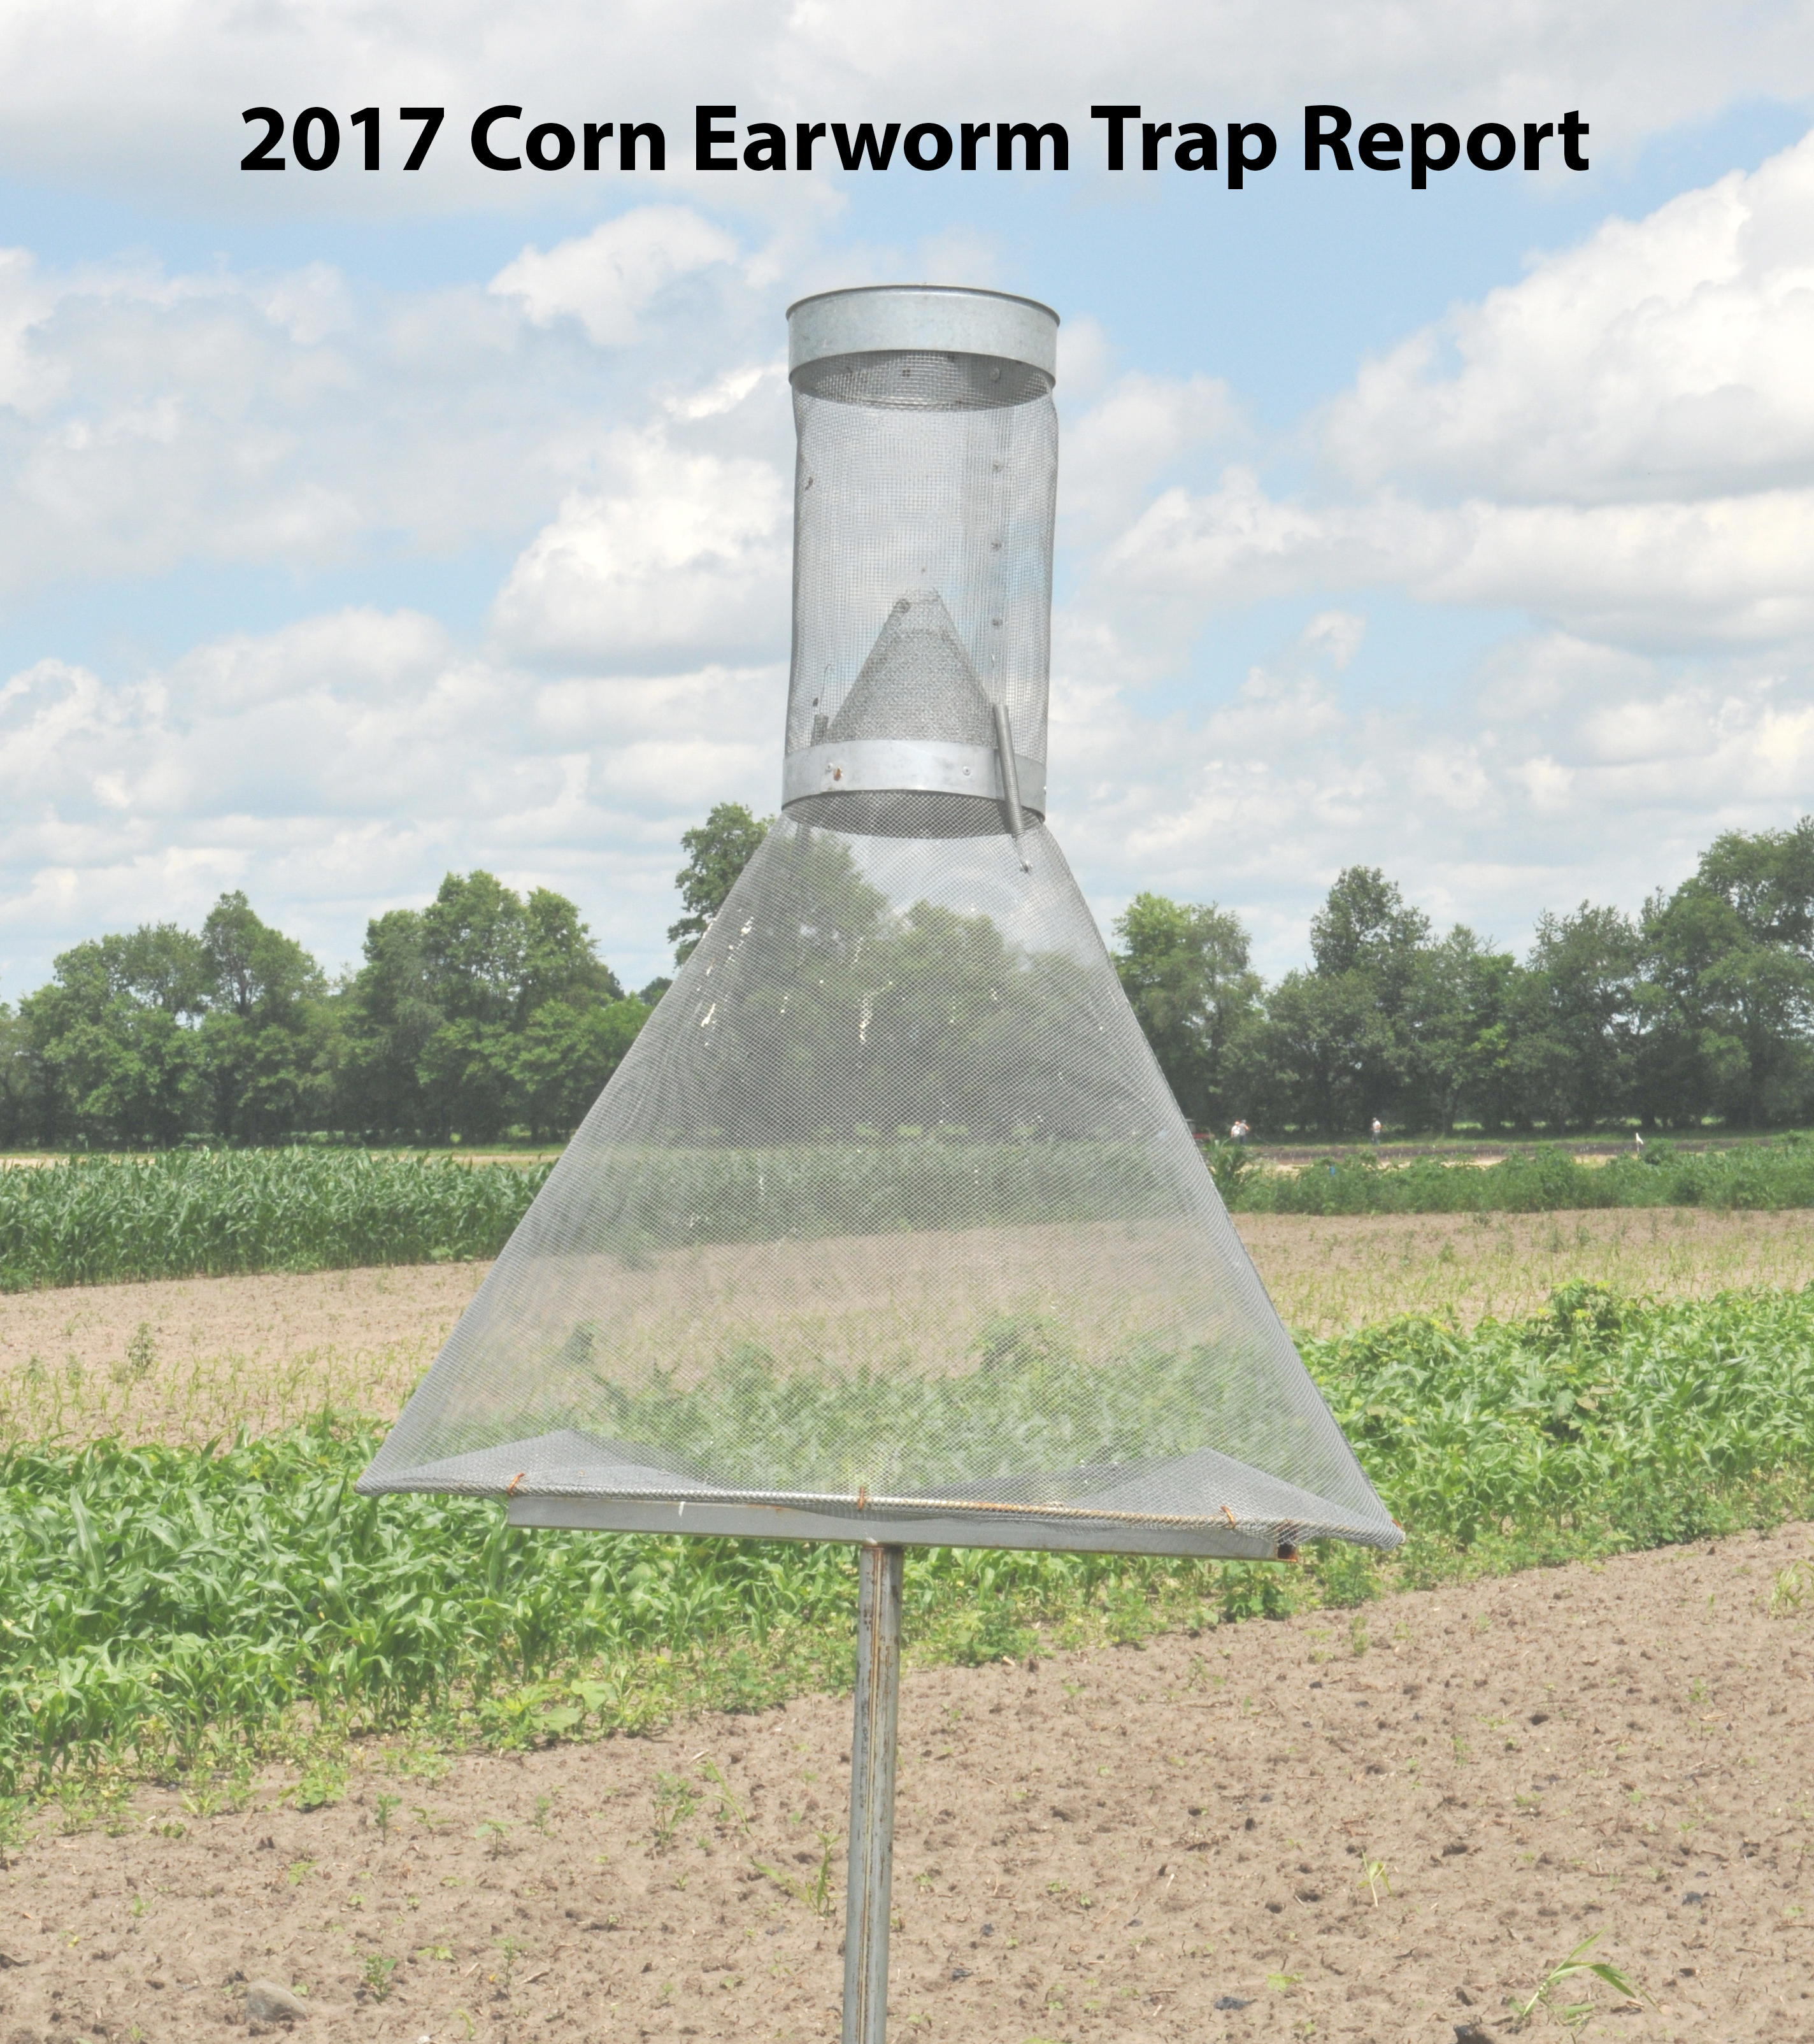
Corn Earworm Trap Report
Bob Nielsen visits a cornfield during pollination in west central Indiana. Shown and discussed is a quick-test, by dissecting and shaking the corn ear, to check the progression of pollination. This test determines the success of ovule (kernel) fertilization, but cannot be used as a yield estimate. Fertilized kernels, if subjected to stress (e.g., drought) may still abort or poorly fill, causing reduced yields. Article: http://www.agry.purdue.edu/ext/corn/news/timeless/EarShake.html
Earlier this spring, we visited this cornfield to evaluate for emergence problems. See the video we created at the time: https://youtu.be/3NCU4AliCII. Continual rains afterwards kept the producer out and replanting into poor populated areas wasn't possible until June 1st, about 6 weeks after the original planting. Now we visit this field just over a month after replanting/overseeing, and in hindsight, consider the implications now and later into the season, especially with harvest. With the aide of aerial photography, via a drone, it becomes very clear that hybrids are dramatically different in their tolerances to early season stressors. Something to be said about hybrid selection for soil types and anticipated planting dates.
Providing sufficient but not excessive nitrogen (N) to corn is difficult especially with fall and early spring fertilizer applications where N loss can vary substantially with the timing of the application relative to the occurrence of warm soil and excessive rainfall. Nitrogen deficiency occurs most growing seasons and often leads to an interest in applying N fertilizer beyond the growth stage and height where standard N application equipment can be used.
Nitrogen applied up to 2-3 weeks after silking to N deficient but otherwise healthy corn can result in increased grain yield. The greater the N deficiency and the earlier the N application the larger the yield increase. An irrigated 2-year study conducted in Nebraska illustrates this point well.1
Rates of N were applied from 0 to 300 lb N/ac at planting to establish different levels of N sufficiency. Nitrogen sufficiency (SI) was quantified with a SPAD chlorophyll meter by measuring greenness of the most recently collared leaf in sub-optimal N rates compared to the highest N rate (SI=1 indicates no N deficiency).
At V8 the application of N to corn with an SI=0.95 (slight N deficiency) increased yield about 14 bushels per acre (bu/ac). With greater N deficiency (SI=0.65) the yield increase was nearly 80 bu/ac (see figure to right).
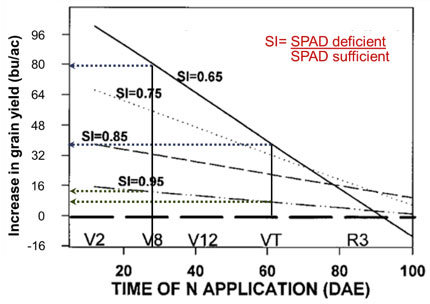
Increase in grain yield and time of N application (DAE).
Nitrogen applications later in the season were not able to produce as great a yield increase as those obtained at V8. Nitrogen applied at tasseling (VT) to corn with an SI=0.65 increased yield less than 40 bu/ac. At an SI=0.95 at VT the increase in yield with N application was about 8 bu/ac.
Irrigation provides a means to apply N, move it into the rootzone, and keep the rootzone moist; optimizing N uptake and grain yield response to late-season N. Limited rainfall in non-irrigated fields may hinder response to late-season N application.
Research in Indiana under rainfed conditions can be used to illustrate this point (Dan Emmert - M.S. thesis, 2009)2. Grain yield was increased 27 and 40 bushels per acre at two locations in west-central Indiana by a V13 N application of 175 lb/ac. Little rainfall occurring in the first 2 to 3 weeks after application and total rainfall after the N application was 10 and 15 inches, respectively for the two locations. Yield with the late-season N application was 114 and 139 bu/ac reflecting less than ideal conditions throughout the season.
With more timely and greater rainfall (0.3” of rainfall one and two weeks after the late-season N application and total of 20 inches after application), a yield increase of 64 bu/ac and a maximum yield of 184 bu/acre was realized in a study conducted in northwest Indiana.
With better growing conditions at this same location in 2010 and 2011 an additional 100 bu/ac were made by applying high rates of N at V15 and V12 to N deficient corn (see below – Eric Miller - M.S. thesis, 2012)3. Optimum yield ranged from 215 to 240 bu/ac.
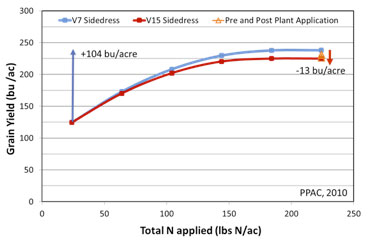
Grain yield and (bu/ac) and total N applied (lbs N/ac).
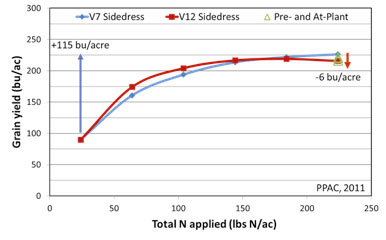
Grain yield and (bu/ac) and total N applied (lbs N/ac).
The previous mentioned trials had little N applied early in the season so N deficiency was relatively strong and the yield response to applied N was large. Smaller responses should be expected with less severe N deficiency. Three on-farm trials with 50 to 150 lb N/ac delayed to V9 or beyond showed little to no yield benefit of holding back some of the N because N deficiency was minimal (Table 1).
Table 1. Effect of delayed N on corn grain yield at three on-farm locations. Timing, rate, and method of application varied at the different locations.
| V3-V4 Sidedress N (lb/ac) at Growth Stage |
V9+ Sidedress N (lb/ac) at Growth Stage |
V12-V15 Sidedress N (lb/ac) at Growth Stage |
Brookston/Crosby 2015 Grain Yield, bu/ac |
Brookston/Crosby 2016 Grain Yield, bu/ac |
Blount/Pewamo 2016 Grain Yield, bu/ac |
|---|---|---|---|---|---|
| 200 | 0 | 0 | 204 a* | 196 b* | |
| 150 | 50 | 0 | 198 b | ||
| 150 | 0 | 0 | 197 a* | ||
| 150 | 0 | 50 injection | 197 b | ||
| 150 | 0 | 50 Y-drop® | 202 a | ||
| 100 | 100 | 0 | 208 a | ||
| 100 | 50 | 50 injection | 204 a | 197 b | |
| 100 | 50 | 50 Y-drop® | 201 a | ||
| 100 | 0 | 50 dribble | 195 b | ||
| 100 | 0 | 50 Y-drop® | 198 a | ||
| 75 | 0 | 75 dribble | 194 b | ||
| 75 | 0 | 75 Y-drop® | 194 b | ||
| 50 | 150 | 0 | 208 a | ||
| 50 | 75 | 75 injection | 206 a |
+All V9 applications were injected with a solid shank coulter on a high-clearance applicator.
*Means followed by different letters differ by LSD test with a probability of >90%.
Several effective methods can be utilized to apply N to tall corn. A solid shank applicator (pictured left) that injects N into a coulter slit a couple of inches deep into the soil prevents ammonia (NH3) volatilization from liquid urea-ammonium nitrate. Alternatively the same high-clearance applicator can be fitted with drop tubes or Y-Drops® to place the liquid N in a narrow band on the soil surface. Although NH3 volatilization may occur when liquid N is left on the soil surface the magnitude of loss is likely less than 5% of the N applied when banded in full canopy corn.
Granular urea can also be spread by airplane or high-clearance box spreader (pictured right). Fifteen to 30% of the N applied in broadcast urea may be lost to NH3 volatilization. Compensating for potential N loss by applying a higher N rate or by using a urease inhibitor to reduce NH3 loss (NBPT or NPPT) should be considered.
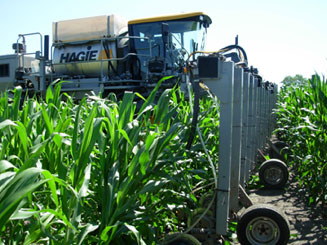
A solid shank applicator applying N to tall corn.
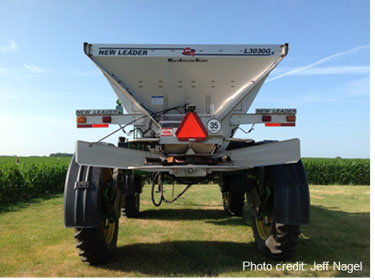
High-clearance box spreader spreading granular urea.
Differences among application methods in crop damage, speed of application, and other practical factors should also be considered when choosing among methods of application.
Irrigated corn provides the easiest opportunity to apply N to corn. Fertigating with liquid urea-ammonium nitrate is an efficient cost-effective way to provide late-season N to corn. Often 20 to 30 lb N/ac are applied per N application, but as much as 50 lb N/ac can be applied with sufficient dilution to avoid foliar burn. Adding N to irrigation water increases the importance of irrigation system application uniformity as water and N both have substantial impact on crop growth and yield. Since irrigation maintains high soil moisture, leaching and/or denitrification of N may occur with excessive irrigation or rainfall. Thus multiple smalll rates of N application are helpful in reducing N loss. Additional guidelines for fertigation can be found in Irrigation Fact Sheet #12.4
Corn has tremendous capacity to respond to late-season N application provided the plant is N deficient, but otherwise healthy. The earlier the application the better but profitable responses have been obtained as late as 2 to 3 weeks after tasseling. In non-irrigated systems there are advantages and disadvantages to each application method and source with no clear winners or losers. Injecting urea-ammonium nitrate into irrigation water is the most convenient application method when irrigation is available.
1Maize Response to Time of Nitrogen Application as Affected by Level of Nitrogen Deficiency. 2000. D.L. Binder, D.H. Sander, and D.T. Walters. Agron. J. 92:1228–1236.
2Using Canopy Reflectance to Monitor Corn Response to Nitrogen and the Effects of Delayed Nitrogen Application. M.S. Thesis, Purdue Univ., May 2009.
3Nitrogen Application Timing and Rate Effects on Nitrogen Utilization of Corn and the Adoption of Active Optical Reflectance Sensors for Nitrogen Management. M.S. Thesis, Purdue Univ., May 2012.
4Irrigation Fact Sheet #12 - Nitrogen Application with Irrigation. Lyndon Kelley. http://msue.anr.msu.edu/uploads/236/43605/FactSheets/12_NitrogenApplicationWithIrrigationFact_Sheet.pdf
We gratefully acknowledge the support provided for research conducted by Dan Emmert and Eric Miller by the Indiana Corn Marketing Council, Pioneer Hi-Bred Int’l, A&L Great Lakes Labs (discounted analysis costs), Purdue Univ. Office of Ag Research Programs, and all of the Purdue Ag Center staff.
An additional note: We ran the article below in OSU’s newsletter earlier this week. Based on some feedback from those in the crop protection industry, we realized that we might have confused some readers into thinking volatility and inversions are the same thing. We are working on an article to better explain the difference between volatility and particle movement in an inversion for an upcoming newsletter article. Unfortunately, it is difficult for even the most experienced weed scientists and crop advisors to differentiate these two situations and they are frequently lumped together. More on this in an upcoming article!
You would probably have to be living under a rock to not at this time be aware of the issues with off target dicamba movement affecting soybeans and other plants in the states of Tennessee, Arkansas, and Missouri. The latter two states just banned any additional dicamba applications for the remainder of the growing season to avoid additional problems (subject to change probably), and some changes are coming in Tennessee also apparently. We have seen firsthand examples of this in at least some Indiana and Ohio fields, and have heard about a number of additional ones. It’s somewhat difficult to gauge how widespread the issue is, since there is often reluctance of an affected party to contact regulatory officials and file a complaint, in order to keep good relations with the offending neighbor. This has been a trend over the years where applications of dicamba-containing products to corn have affected nearby soybeans – neighbors tolerating each other – partly based on the knowledge that soybean yield often appears to be unaffected by early-season dicamba exposure .
Our conclusion at this point based the fields we have examined is that the patterns of injury are indicative of both particle drift and volatility. However, an alarmingly high number of fields seem to show that we have more offsite movement due to volatility than we thought would happen based on past experience with dicamba use in corn and the development of lower volatility formulations of dicamba products labeled for use in Xtend beans. This is not to say that spray particle drift is not occurring. It is evident that in many situations, dicamba is being applied in too much wind, or with no buffer left between the treated field and adjacent non-Xtend soybeans. We certainly have had the “perfect storm” of limited days to spray with wet weather delaying field operations. When soil conditions were suitable for sprayer traffic, the winds were often excessive and we likely had herbicide applied during inversions as we rushed to get work done. However, with such an abundance of fields that show uniform symptomology across the entire field, we wanted to raise awareness of this situation and attempt to explain drift vs volatility. There is certainly a lot more to learn about how volatile these new products are under varying conditions. We would most likely expect some changes in how they can be used between now and next year, at least in certain states. The purpose of this article is to discuss particle drift versus volatility, and what history tells us about volatility and symptom development for dicamba products that have some volatility, and also the effect of exposure on soybean yields. This information may be helpful in the assessment of situations where dicamba injury occurs.
In some fields that we have examined, the symptoms of dicamba on sensitive soybeans have occurred at far greater distances, and at much more uniformity, than can be explained simply by spray particle drift. Spray particle drift has a telling pattern, which most anyone in the industry has observed at one time or another for various herbicides. The dosage and symptoms in an adjacent sensitive crop are greatest closest to the treated field, due to the highest frequency of larger spray droplets settling out fairly rapidly. For this reason, one indicator of spray particle drift is herbicide symptomology on weeds growing along an adjacent roadside or in a fencerow between the two fields. The injury then tapers off with distance from the treated area as a decreasing number of smaller droplets continues to settle out, until the point where no injury occurs due to insufficient number of droplets and dosage to cause injury. How sensitive the affected crop is comes into play here also, since it takes a lower dosage to cause injury on a more sensitive crop. Spray droplets can move well into an adjacent field, depending upon wind, temperature, nozzles, pressure, use of drift-reducing agents, etc.
But particle drift does not result in the relative uniformity of dicamba injury over a large adjacent field that has occurred in some cases. This would be more indicative of movement via dicamba volatilization from leaf or soil surfaces, occurring sometime within several days after application. Vapors then move with prevailing air currents, with potential to move far greater distances than spray particles, upwards of a half mile. Movement of vapors does not require much wind. For example, volatilization of dicamba that occurs under relatively still inversion conditions can result in prolonged suspension and movement of vapors with gentle air currents. In one field we looked at, there appeared to be an initial volatilization event from the adjacent dicamba-treated soybeans, with some subsequent soybean recovery. This appeared to followed by a second round of dicamba exposure and injury to the recovering soybeans several weeks later.
Soybeans may not show symptoms of dicamba until 10 to 21 days following exposure, when the injury becomes evident in newest growth. Injury takes the form of leaf wrinkling and cupping, and new leaves trying to expand emerge may remain tightly cupped and small. Higher doses can cause terminal growth inhibition (shorter plants) that are slower to cover the row middles. As soybeans recover, new growth will eventually emerge without symptomology. The ability of soybeans to recover from injury, the rate of recovery, and effect of yield is dependent upon dosage and subsequent environmental conditions, and obviously whether they are exposed to dicamba again while trying to recover. Exposure to dicamba in the vegetative stages has less long-term effect and potential to reduce yield compared with exposure in the reproductive stages. Our experience with injury during the vegetative stages is that it rarely leads to yield loss, unless there is a significant reduction in plant height. This assumption is based on continued suitable environmental conditions for soybean growth and seed fill prior to harvest. With regard to injury from most herbicides, late-planted soybeans can be generally more of a concern since they have less time to develop full yield potential anyway, especially in sub-optimum environments.
The purpose of this article is to give a brief update of weed science issues we have recently encountered in Indiana.
Marestail. We are seeing many soybean fields with marestail one to 3 ft tall in both patchy and uniform infestations. Most of these are likely due to inadequate control measures with burn down herbicides. This spring was challenging to do effective burn down treatments, especially for weeds that are tough to kill like marestail. Inevitably our best control came from those situations where fall applied herbicides were used and followed up with spring treatments to clean up any marestail emerging in the spring. Unfortunately, if you have living marestail plants in Round Ready beans and the marestail are resistant to both glyphosate and ALS herbicides, you have no reliable herbicide control measures other than hand weeding. If the soybeans are Liberty Link or Xtend, then Liberty or the approved dicamba formulations, respectively, could be used for postemergence control.
Waterhemp. Waterhemp is coming on strong in many areas of the state…..again. We still have people asking ”Where did it come from?”. It only takes a few plants going to seed to result in a very heavy population the next year. Waterhemp has been in the state for many years. Areas infested have increased over the last couple years because of the wet springs that we have had and this year certainly fits that pattern. Most of the waterhemp we have observed is resistant to glyphosate, and a significant portion, or 25% or more of the populations, are also resistant to group 14 or PPO herbicides. If you have multiple-resistant waterhemp and Roundup Ready soybeans, you don’t have any postemergence control options, other than hand weeding. If you have Liberty Link beans or Xtend beans, you have some postemergence tools available to help.
Dicamba. Recently there has been quite a bit of press related to dicamba because of hundreds of reports of off-site movement in Arkansas, Missouri, and Tennessee. Arkansas and Missouri have temporarily suspended use of dicamba products. Tennessee has approved stricter rules for applications between now and the end of the growing season. In most of the Midwest, we have not been immune to symptoms of dicamba on nontarget vegetation. However, we have not had nearly the number of drift complaints filed with the Office of the Indiana State Chemist. As of Wednesday, July 12thth, approximately 140 unconfirmed off target drift complaints had been filed with the office of the Indiana State Chemist, with around 46 of these complaints related to growth regulator or auxin type herbicides. In addition, see the attached map for the counties from which we have received suspected drift samples into the Plant Pest Diagnostic Lab. So, the bottom line is that we have had relatively few complaints filed on this issue compared to our neighbors in Missouri, Tennessee, and Arkansas. Speaking with my colleagues in adjacent states this week it appears we are all experiencing similar or even lower levels of drift complaint reporting.
Recently Dr. Mark Loux and I wrote an article on the dicamba subject and attempted to explain some things related to drift, volatility, and inversions. The reason we wrote this article was because we were seeing a fairly high incidence of fields that show injury symptoms uniformly across the entire field, which leads us to believe that spray drift did not cause that type of injury. What will cause that type of injury pattern is dicamba movement due to volatility and the dicamba movement as a spray particle under inversion conditions. What we fear is happening out in the countryside is that this type of injury uniformly across an entire field is being blamed solely on volatility when much of it could be caused by physical movement of spray particles during inversions. Based on some feedback from that article, it appears we didn’t do a great job of distinguishing the difference between volatility and inversions. The symptoms you will see in the field from volatility and inversions will be difficult to differentiate from one another. Remember this fact, volatility is dicamba movement in the vapor phase and inversion movement is dicamba movement as a spray particle that has been suspended in the air due to temperature differences between the area just above the soil surface and the temperature of the area a few feet above this. It’s our belief that many spray applications were made during inversion conditions to avoid the higher windspeeds that occur during the middle part of the day. So based on what we’ve seen so far, it is pretty difficult to distinguish movement from volatility versus movement from inversions, but the reality is that the uniform distributions of injury across an entire field could be due to either volatility, movement in an inversion, or both. The reason we make this point is that it will be difficult to rule out one or the other during the investigation process.
I am sure there are more topics out that that we could cover, but this covers the issues that we have spent the most time on over the past two weeks.
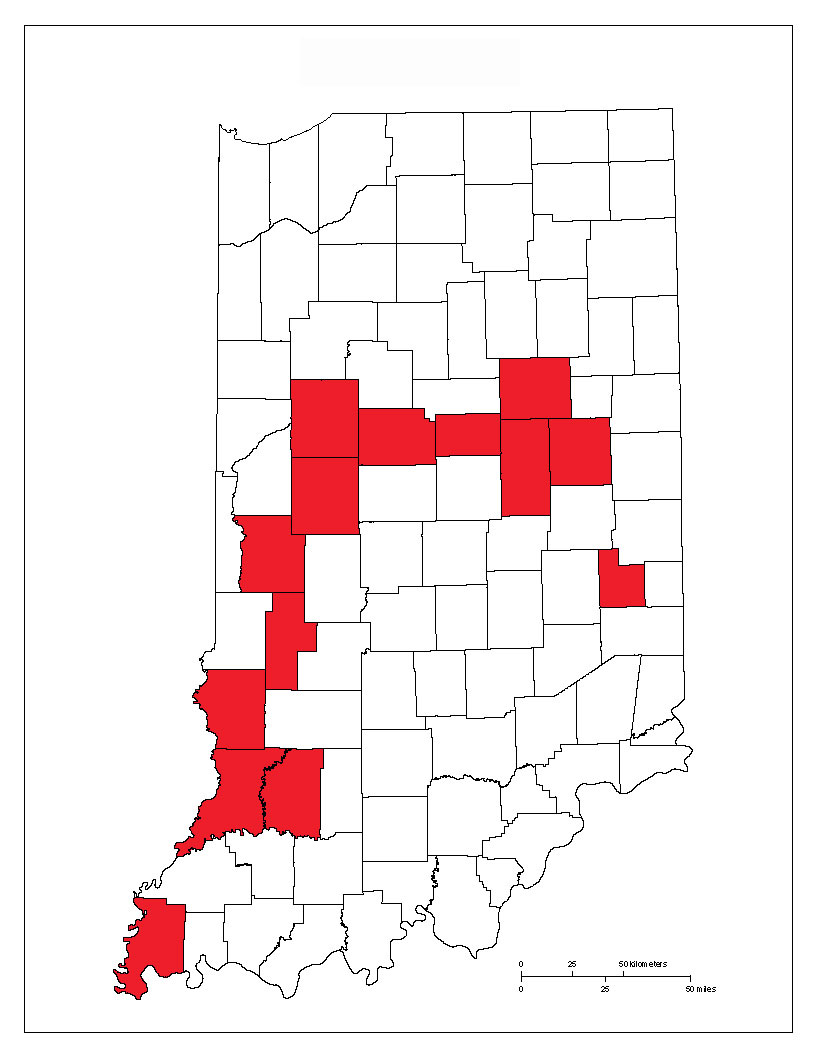
Dicamba drift map.
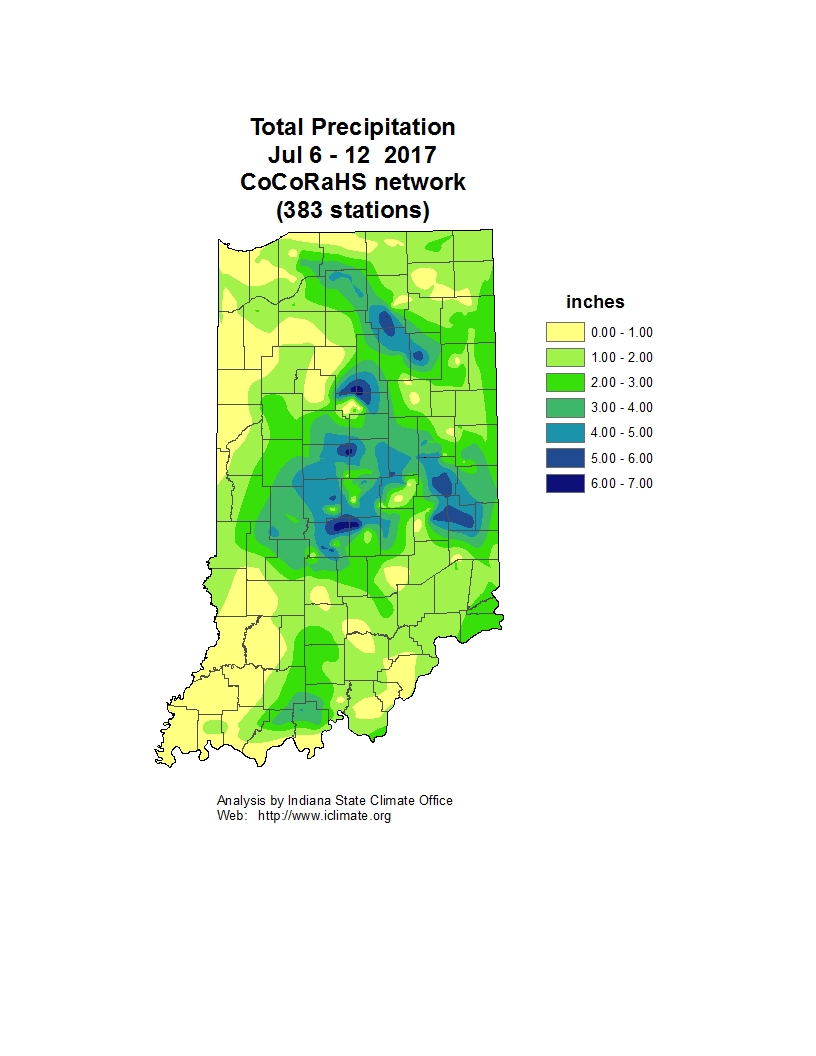
Recent rainfalls have been timely and many areas have adequate moisture for the peak crop water use period for corn and soybeans. Mid- to late-July corn will use 1” of water every 4 hot days or every 5 cloudy or cooler days. Soybean during this time will use 1” of water every 5 hot days or every 6 to 7 cloudy or cooler days.
Many irrigators use pET data (potential evapotranspiration) to help schedule their irrigation applications. The term reference evapotranspiration (rET) may also be used. Michigan and Indiana use 6” tall grass as the reference crop for reporting pET. Mid- to late-July pET values will vary greatly depending on cloud cover and temperature from 0.15” to 0.27” per day, but when averaged over mid- to late-July, most years will be 0.20” to 0.21” per day. Irrigator will need to apply 120% of pET for corn from tassel through dough stage to meet water needs. Soybean will use 100% of pET at first blossom and increase water needs to 120% of pET from R3 (beginning pod) through R-6 (full seed stage)
Indiana producers may use data from their own ET gauge station or rET data from Purdue’s PAC weather stations. They would then take that number and multiply by 1.2. Multiply that result by 7 (days) to estimate the corn water use per week.
Michigan and Indiana producers in the adjacent counties can have daily rET data sent to them by email or text by signing up for the service at MSU’s Enviroweather website. Messages are sent at 5:30 AM each day providing rET data for the previous five days and estimates of projected rET for the following 7 days from any of the networks 87 stations. Estimates of rET can also be found by going to the Enviroweather web site—follow the link to Potential Evapotranspiration and the Water-Use Tool heading.
To make the best use of irrigation water, producers should try to provide 5 or 6 days’ worth of crop water use per application, typically 1–1.25”. These larger irrigation applications increase the amount of effective water available to the crop by reducing the water loss by evaporation in the corn canopy and on the residue and soil surface—about 0.1” per application regardless of the amount applied. A producer making two 0.5” applications provides 0.8” of effective water, compared to a producer making a single 1.0” application that provides 0.9” of effective water. Irrigators with center pivots that apply water faster than the soil can infiltrate are forced to use smaller applications (less than 0.5”) to avoid irrigation runoff.
The time of day irrigation water is applied has not been critical. “We have seen no major advantage or disadvantage irrigating crops either during the night or day”, says Lyndon Kelley, irrigation educator with Purdue University and Michigan State University. “Avoiding afternoon irrigation, making multiple small applications and using pivot drop nozzles are all management practices developed for the arid west and have little to no advantage in irrigating Indiana and Michigan fields. Applying water when the crop needs it shoul be the producer's most important mission."
Visual signs of water stress in corn occur too late to use as a good irrigation scheduling method without lowering yields. The corn plant has a natural defense mechanism that rolls the leaves up to cut the amount of sunlight that is captured. During extremely hot days, corn may roll even if it has adequate water. A good indication of under-watering is when corn leaves are still rolled into the early evening hours or, worse yet, into the pre-dawn hours. This symptom represents severe stress and will likely reduce potential yield. Compacted areas or sandier parts of a field can be monitored for leaf rolling, providing an early warning of the field's moisture status for the rest of the crop.
Irrigation applications made prior to the heat of the day can be beneficial to pollinating corn when afternoon temperatures are extremely high. By wetting the canopy and soil surface, temperatures are lowered and the relative humidity is raised, both of which can help the pollination process. The myth of “cold shock” to the crop scares some producers into avoiding irrigation just when it is needed the most.
For more information on irrigation water use and when to irrigate see Fact Sheet #3 “Irrigation Scheduling Tools.”
Purdue Cooperative Extension Service
Purdue Extension Entomology
901 W. State Street
West Lafayette, IN, 47907
(765) 494-8761
luck@purdue.edu
@PurdueExtEnt
PurdueEntomology
If you would like to be alerted by e-mail when the current issue of the Pest&Crop is available on-line, please enter your e-mail address and click the submit button.
It is the policy of the Purdue University Cooperative Extension Service that all persons have equal opportunity and access to its educational programs, services, activities, and facilities without regard to race, religion, color, sex, age, national origin or ancestry, marital status, parental status, sexual orientation, disability or status as a veteran. Purdue University is an Affirmative Action institution. This material may be available in alternative formats.