Pest & Crop
Newsletter
Purdue Cooperative Extension Service
Purdue Cooperative Extension Service
Issue 8, May 27, 2016 • USDA-NIFA Extension IPM Grant
CLICK HERE FOR A PDF VERSION OF THIS ISSUE ![]()
It is important to consider the risk for Fusarium head blight (FHB), or scab, development as wheat approaches flowering. The fungus that causes FHB, Fusarium graminearum, infects wheat during flowering, beginning at FGS 10.5.1. Symptoms appear later in the season and include bleached spikelets on the head, and small or shriveled grain kernels, commonly called “tombstones”. The fungus also produces mycotoxins, such as deoxynivalenol, or DON, which can accumulate in the infected grain. Rainy, warm, and humid weather conditions favor disease development. If varieties susceptible to FHB have been planted, or farmers are worried about the risk of FHB development, they may want to consider a fungicide application at early flowering for suppression of FHB. To accurately growth stage wheat and determine when wheat is beginning to flower, please see Purdue Extension publication ID-422 “Managing Wheat by Growth Stage”.
For more information about Fusarium head blight and fungicide timing for FHB, please see Purdue Extension publications BP-33 Diseases of Wheat: Fusarium Head Blight (Head Scab), and BP-145: Diseases of Wheat: Revised Fungicide Spray Recommendations for Fusarium Head Blight.
Stripe rust (Puccinia striformis) is a fungus that produces a yellowish or orange spore, and pustules appear in a row on infected leaves, giving it a “striped” appearance. Purdue Extension Bulletin BP-79-W, “Identifying Rust Diseases of Wheat and Barley” is available to aid in diagnosis of stripe rust, and can be found at the following link: https://mdc.itap.purdue.edu/item.asp?itemID=19349. It is important to consider variety susceptibility to stripe rust, growth stage, and disease spread before applying a fungicide for stripe rust management.
Conventional wisdom says that the prime planting window to maximize corn yields in much of Indiana opens about April 20 and closes about May 10. This “window” typically opens about one week later across the northern tier of Indiana counties (later warmup) and about one week earlier across the southern tier of Indiana counties (earlier warmup). The 2016 planting season for corn in Indiana has been a slow and lengthy one, with only 62% of the state's corn crop reported as planted by 22 May, compared to the running five-year average of 77% (USDA-NASS, 2016a). What are the consequences of a delayed start to planting? How important a predictor of statewide corn yield is planting date anyway? Does late planting in and of itself guarantee lower than normal yields? Good questions, but the effect of planting date on statewide average corn yield is simply not clearcut.
If one reviews USDA-NASS crop progress reports for the past 20 years (USDA-NASS, 2016b), there is NOT a strong relationship between planting date and absolute yield on a statewide basis for Indiana. Specifically, percent departures from annual trend yields are not strongly related to corn planting progress. Figures 1 and 2 illustrate this relationship for two measures of statewide planting progress; percent acres planted by April 30 or by May 15. Even though one can statistically define mathematical relationships between departures from statewide trend yield and statewide planting progress by April 30 or May 15, the relationships only account for 9 to 16% of the variability in trend yield departures from year to year. In other words, a number of yield influencing factors (YIFs) in addition to planting date also affect the ultimate absolute yield for a given year.
Why is it that every corn agronomist worth their salt preaches about the importance of timely planting and yet the statewide statistical data suggest that planting date accounts for less than 20% of the variability in statewide yields from year to year? Let's look more closely at this apparent conundrum.
It is true that relative grain yield potential of corn declines with delayed planting after about May 1 (Myers & Wiebold, 2013, Nafziger, 2008; Nafziger, 2011). Estimated yield loss per day with delayed planting varies from about 0.3% per day early in May to about 1% per day by the end of May. Yield potential goes down with delayed planting because of a number of factors, including a shorter growing season, greater insect & disease pressure, and higher risk of hot, dry conditions during pollination.
However, the good news is that planting date is only one of many YIFs for corn. What is important to understand is that yield loss due to delayed planting is relative to the maximum possible yield in a given year
In other words, if all the other YIFs work together to determine that the maximum possible yield this year for the optimum planting date is 220 bu/ac, then the consequence of a 10-day planting delay beyond April 30 (at 0.3% decrease per day) would be a yield potential of about 213 bu/ac (i.e., 220 bushel potential minus [10 days x 0.3%] due to delayed planting). However, if all the other YIFs work together to determine that the maximum possible yield this year for the optimum planting date is only 150 bu/ac, then the consequence of a 10-day planting delay beyond May 1 (at 0.3% decrease per day) would be a yield potential of about 146 bu/ac (i.e., 150 bu/ac potential minus [10 days x 0.3%] due to delayed planting). Make sense?
Consequently, it is possible for early-planted corn in one year to yield more than, less than, or equal to later-planted corn in another year depending on the exact combination of YIFs for each year. Figure 3 illustrates this often confusing concept. In that graph, a delayed planting of corn in an otherwise high yielding year (B) may still be higher yielding than a crop planted on the optimum planting date in an otherwise lower yielding year (C). Farmers know this to be true because some have had June-planted crops in recent years that ultimately yielded better than any crop they have ever had.............. because the remainder of the growing season following the delayed planting was exceptional.
For example, the crop years 2012 and 2009 represent early and late planting date years respectively in Indiana. About 94% of the state's corn crop was planted by May 15 in 2012, but only 20% of the crop was planted by May 15 of 2009 (Fig. 2). Yet, the earlier planted 2012 crop yielded 38.2% BELOW trend yield for that year and the later planted 2009 crop yielded 10.3% ABOVE trend yield. Why? Important differences in YIFs between the years other than simply the planting dates.
Bottom Line
Let's not succumb quite yet to fearmongering triggered by the frustrations of planting the 2016 corn crop. “Mudding in” a crop early to avoid planting late will almost always end up being an unwise decision.
Furthermore, since delayed planting by itself is no guarantee of lower ABSOLUTE grain yield, I see little reason to change any crop inputs because of delayed planting, other than possibly seeding rates. Delayed planting generally coincides with warmer soil temperatures compared to early planting. Consequently, stand establishment may be more successful with delayed planting, resulting in established plant populations that are closer to actual seeding rates than the usual 90 to 95% success rate with earlier planting dates. So, you might consider slightly reducing your seeding rates with delayed planting.
When faced with prospects of delayed planting, one should certainly look for ways to expedite the planting process by eliminating unnecessary tillage trips or delaying some field operations (Thomison et al., 2015) because there is no reason to purposefully plant any later than necessary.
Related Reading
Myers, Brent and Bill Wiebold. 2013. Planting Date 2013. Univ of Missouri Extension [On-line] http://ipm.missouri.edu/IPCM/2013/4/Planting-Date-2013. [URL accessed May 2016].
Nafziger, Emerson. 2008. Thinking About Corn Planting Date and Population. The Bulletin (No. 2, Article 7, April 4), Univ. of Illinois Extension. [On-line]. http://bulletin.ipm.illinois.edu/article.php?id=890. [URL accessed May 2016].
Nafziger, Emerson. 2011. Corn Planting: Optimism on Hold. The Bulletin (No. 3, Article 9, Apr 22), Univ. of Illinois Extension. [On-line]. http://bulletin.ipm.illinois.edu/article.php?id=1469 [URL accessed May 2016].
Nielsen, RL (Bob). 2015. Corn & Soybean Planting Progress in Indiana Over the Years. Corny News Network, Purdue Extension. [On-line]. http://www.kingcorn.org/news/timeless/PlantingPace.html [URL accessed May 2016].
Thomison, Peter, Steve Culman, & Mark Loux. 2015. Adjusting Corn Management Practices for a Late Start. C.O.R.N. Newsletter, Ohio State Extension. [On-line] http://agcrops.osu.edu/newsletter/corn-newsletter/2015-11/adjusting-corn-management-practices-late-start [URL accessed May 2016].
USDA-NASS. 2016a. Crop Progress (23 May 2016). USDA, National Agricultural Statistics Service. [On-line]. http://usda.mannlib.cornell.edu/usda/nass/CropProg//2010s/2016/CropProg-05-23-2016.pdf. [URL accessed May 2016].
USDA-NASS. 2016b. Crop Progress (archives). USDA, National Agricultural Statistics Service. [On-line]. http://usda.mannlib.cornell.edu/MannUsda/viewDocumentInfo.do?documentID=1048. [URL accessed May 2016].
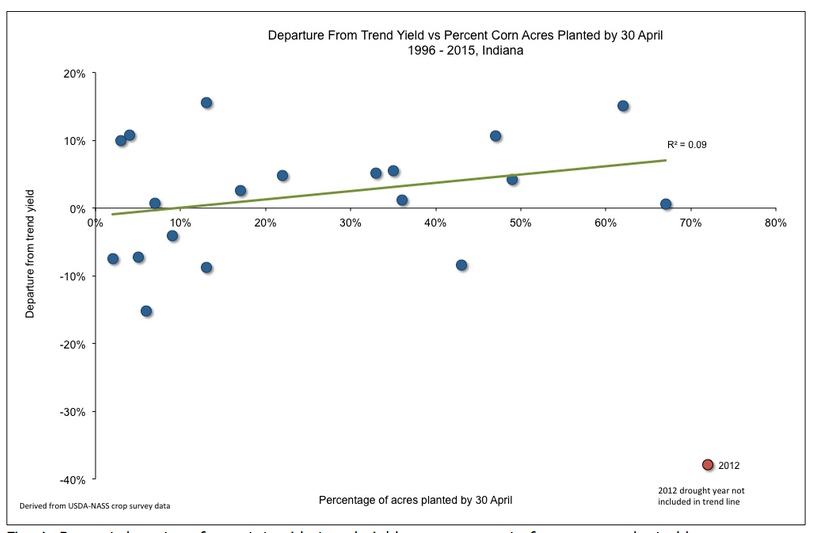
Fig. 1. Percent departure from statewide trend yield versus percent of corn acres planted by April 30 in Indiana, 1996-2015.
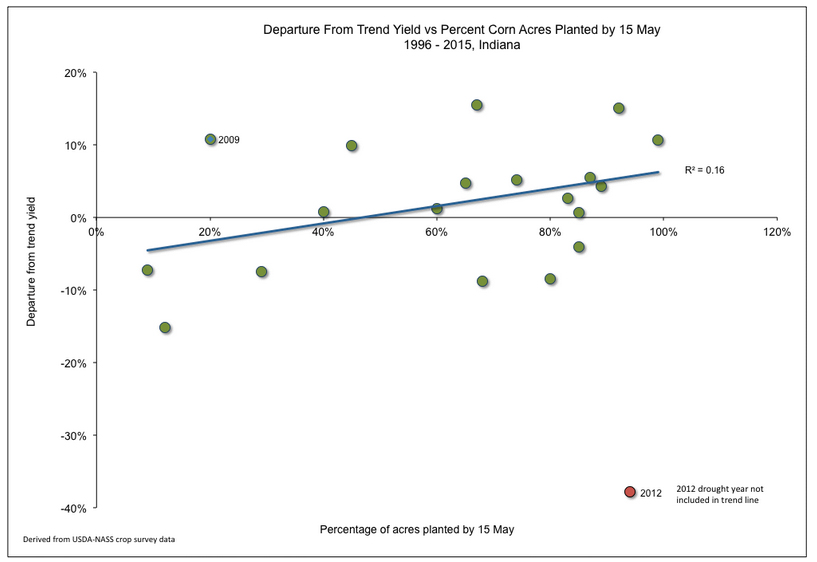
Fig. 2. Percent departure from statewide trend yield versus percent of corn acres planted by may 15 in Indiana, 19896-2015.
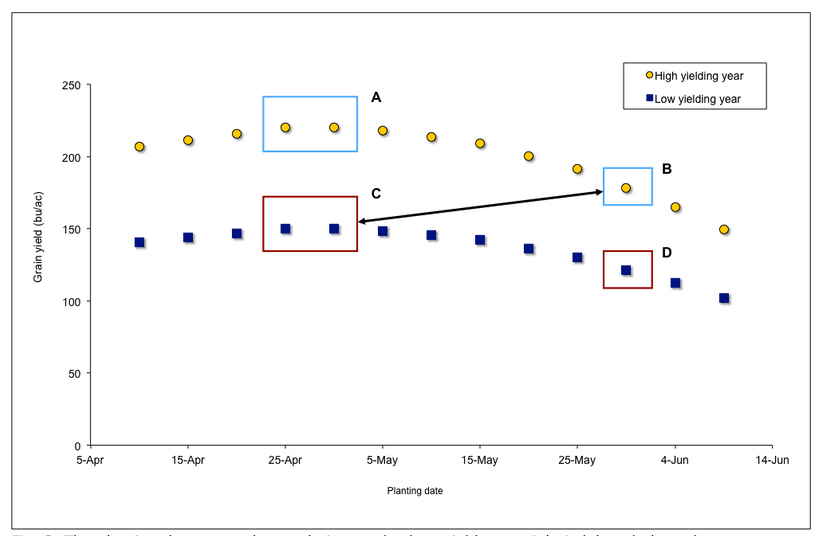
Fig. 3. The planting date conundrum relative to absolute yield: A delayed planted crop in one year (B) can yield better than a crop planted on the optimum date in another year (C).
10-Year Summary of Corn Response to Nitrogen Fertilizer
This report summarizes the yield response to fertilizer nitrogen (N) rat of corn grown in rotation with soybean (corn/soy) in field-scale trials conducted around the state of Indiana since 2016. These results are applicable to N management programs that use efficient methods and timings of N fertilizer application. The average Agronomic Optimum N Rate (AONR) for 52 trials conducted on medium- and fine-textured soils in southwest, southcentral, southeast, and westcentral Indiana was 208 lbs N/ac. The average AONR for 28 trials conducted on medium- and fine-textured soils in northwest and northcentral Indiana was 212 lbs N/ac. The average AONR for trials conducted on medium- and fine-textured soils in other regions of the state were 232, 251, and 263 lbs N/ac for central (23 trials), eastcentral (26 trials), and northeast (11 trials) Indiana, respectively. The average AONR for 16 trials on non-irrigated sandy soils was 202 lbs N/ac. At five Purdue Ag Centers where we conducted paired trials of corn following soybean (corn/soy) and corn following corn (corn/corn from 2007 to 2010, and aveage AONR for corn/corn was 44 lbs greater than for corn/soy while average corn/corn yields were 18 bu/ac less than the corn/soy fields.
Economic Optimum N Rates (EONR) calculated for various combinations of N fertilizer cost and grain price are listed in Tables 2-7 for regions of the state. To see the rest of this article click now.
| County/Cooperator | Wk 1 | Wk 2 | Wk 3 | Wk 4 | Wk 5 | Wk 6 | Wk 7 | Wk 8 | Wk 9 | Wk 10 | Wk 11 | Wk 12 | Wk 13 |
|---|---|---|---|---|---|---|---|---|---|---|---|---|---|
| Dubois/SIPAC Ag Center | 0 | 0 | 348 | 258 | 11 | 6 | 22 | 44 | |||||
| Jennings/SEPAC Ag Center | 0 | 0 | 15 | 18 | 9 | 1 | 9 | 0 | |||||
| Knox/SWPAC Ag Center | 0 | 6 | 197 | 63 | 17 | 39 | 22 | 22 | |||||
| LaPorte/Pinney Ag Center | 0 | 25 | 317 | 296 | 63 | 149 | 121 | 29 | |||||
| Lawrence/Feldun Ag Center | 4 | 97 | 155 | 76 | 42 | 21 | 14 | 14 | |||||
| Randolph/Davis Ag Center | 0 | 0 | 0 | 24 | 122 | 162 | 101 | 14 | |||||
| Tippecanoe/Meigs | 0 | 4 | 141 | 101 | 45 | 50 | 55 | 114 | |||||
| Whitley/NEPAC Ag Center | 7 | 21 | 619 | 1,091 | 376 | 682 | 612 | 173 |
Wk 1 = 3/31/16 - 4/6/16; Wk 2 = 4/7/16 - 4/13/16; Wk 3 = 4/14/16 - 4/20/16; Wk 4 = 4/21/16 - 4/27/16; Wk 5 = 4/28/16 - 5/4/16; Wk 6 = 5/5/16 - 5/11/16; 5/12/16 - 5/18/16; Wk 7 = 5/19/2016 - 5/25/2016
Purdue Cooperative Extension Service
Purdue Extension Entomology
901 W. State Street
West Lafayette, IN, 47907
(765) 494-8761
luck@purdue.edu
@PurdueExtEnt
PurdueEntomology
![]()
If you would like to be alerted by e-mail when the current issue of the Pest&Crop is available on-line, please enter your e-mail address and click the submit button.
It is the policy of the Purdue University Cooperative Extension Service that all persons have equal opportunity and access to its educational programs, services, activities, and facilities without regard to race, religion, color, sex, age, national origin or ancestry, marital status, parental status, sexual orientation, disability or status as a veteran. Purdue University is an Affirmative Action institution. This material may be available in alternative formats.