Pest & Crop
Newsletter
Purdue Cooperative Extension Service
Purdue Cooperative Extension Service
Issue 23, September 23, 2016 • USDA-NIFA Extension IPM Grant
CLICK HERE FOR A PDF VERSION OF THIS ISSUE ![]()
The corn stalk nitrate test (CSNT) can be used as an end-of-season assessment of a nitrogen (N) management program relative to N source, timing, placement, and rate (Brouder, 2003). For this diagnostic test, 15 or more 8-inch stalk segments (beginning 6 inches above the soil surface) are taken from representative areas of a field from about two weeks prior to or 3 weeks after kernel black layer formation and analyzed for nitrate‐ nitrogen (NO3-N). Accumulation of NO3-N in the lower corn stalk results from N availability exceeding crop N utilization.
Although stalk samples are typically collected within two to three weeks after black layer formation in accordance with the guidelines initially suggested by Iowa researchers (Binford et al., 1990), there is interest in assessing N management for silage corn which is harvested prior to black layer. Pennsylvania researchers compared results and interpretation of corn stalk NO3-N samples taken at ¼ milk line (milk line positioned about 25% of the distance from the dented crown to the kernel tip) to those obtained 1 to 3 weeks after black layer (Fox et al., 2001). Stalk NO3-N levels did not differ among samples taken between ¼ milk line and 1 to 3 weeks after black layer for 176 of 209 comparisons. Where differences occurred, there was no strong trend in the direction of change; 20 increased and 13 decreased from ¼ milk line to black layer. The researchers concluded that the interpretation of the CSNT in Pennsylvania was the same for samples obtained beginning at ¼ milk line through a few weeks after black layer (Beegle and Rotz, 2009).
Previous research conducted in Indiana in 1996 and 1997 concluded that NO3-N concentrations less than 450 ppm were low, between 450 and 2,000 ppm were associated with optimal N availability, while concentrations greater than 2,000 ppm NO3-N indicated
N availability was excessive (Brouder, 2003). The relationship between corn stalk NO3-N and relative yield from our more recent 35 site-years of N response trials conducted in 2007‐2009 and 2011-2013 (Fig. 1) are similar to earlier findings, suggesting similar interpretations are relevant for modern hybrids. Most of our studies were conducted with at-‐planting or sidedress N application of 28% urea-‐ammonium nitrate. Although the timing and form of N were not found to alter the relationship between corn stalk NO3-N in earlier Iowa and Indiana research, recent research conducted in Iowa (Kyveryga and Blackmer, 2013) suggests the fall application of manure may need to be evaluated differently (discussed later).
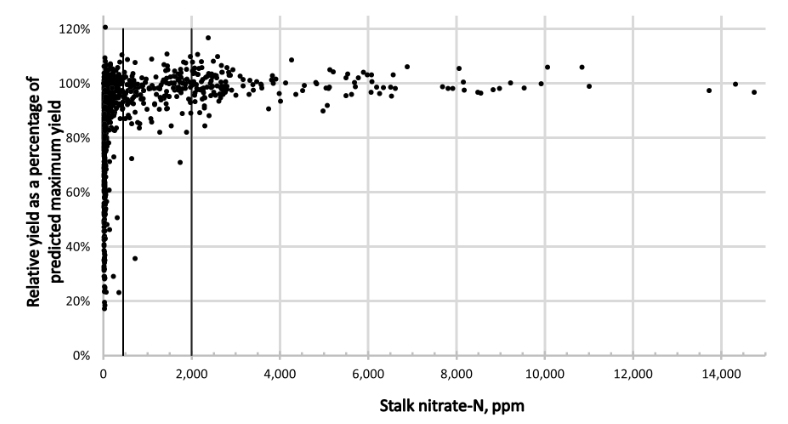
Figure 1. Stalk nitrate-N relationship with relative yield for 35 site-years of N trials conducted in Indiana from 2007-2009 and 2011-2013. Within each location and year the yield of an individual N rate treatment was related to the predicted maximum yield at that location in that year. The vertical bars indicate the divisions between low, optimal, and excessive levels as originally defined by Brouder (2003).
Sixty-three percent of corn stalk samples had NO3-N concentrations less than 251 ppm (Table 1). Relative grain yield in this low NO3-N category ranged from less than 20 to greater than 100% of maximum yield (Figure 1) and averaged 81%. Almost all relative yields less than 80% of maximum yield were associated with corn stalk NO3-N concentrations less than 251 ppm (Figure 1). However, 17% of corn stalk NO3-N concentrations less than 251 ppm were associated with N rate treatments producing 98 to more than 100% of maximum yield. Therefore, low corn stalk NO3‐N does not always mean the crop was short of N.
Twenty-one percent of corn stalk samples had NO3-N concentrations between 251 and 2,000 ppm, which is categorized as optimal. All but 3 of 216 observations in this category had relative yields greater than 80% (Figure 1). At the lower end of this category, between 251 and 500 ppm NO3-N, average relative yield was 96% and the average N fertilizer deficit was 27 lb N/acre (Table 1). At the upper end of the optimal category, 1,501-2,000 ppm NO3-N, average relative yield was 99% and an average fertilizer surplus of 5 lb N/acre occurred.
Recommended N fertilizer rates target maximum profit, not maximum yield, thus they are lower than N rates needed to achieve maximum yield. At a commonly occurring corn grain to pound of N price ratio of 10 to 1 [grain at $4/bushel and N at $0.40/lb N ($225/ton 28% UAN)], economic optimum N fertilization rates are approximately 15 to 20 lb N/acre less than those needed to obtain maximum yield (Camberato et al., 2014). Therefore, corn stalk NO3-N levels between 1,000 and 2,000 ppm on average represent economically optimum N fertilization rates.
Eleven percent of corn stalk samples had NO3-N concentrations between 2,001 and 4,000 ppm. Average relative yield was 100% and average excess N was 33 lb N/acre.
Although it would be ideal to apply the optimum fertilizer N rate every year, it is not likely to happen. Based on our field-scale research, plus or minus 30 lb N/acre is a normal variation for optimum N rate from year to year for a particular cropping system. Although one year with corn stalk NO3-N between 2,001 and 4,000 ppm does not necessarily warrant a change in N management, multiple years at this level indicate the chosen N rate is higher than necessary for achieving maximum yield, as well as profit, and a reduction in N rate is suggested.
Corn stalk NO3-N concentrations between 4,000 and 8,000 ppm represented 4% of the samples obtained and were associated with excess N applications averaging 53 pounds per acre greater than that needed to achieve maximum yield (Table 1). Less than 2% of corn stalk samples had NO3-N greater than 8,000 ppm. The average excess N application was 77 pounds of N per acre for this category.
Table 1. Relative yield (as % of predicted maximum yield within each of 35 location-years)and N rate deficit (-) or excess (+) (relative to the N rate needed to maximize yield in thatlocation-year) for various categories of end-of-season corn stalk NO3-N. Individual data pointsare shown in Fig. 1.
| Corn stalk NO3-N, ppm | Relative % yield | N deficit (‐) or excess (+), pounds per acre | Number of observations |
|---|---|---|---|
| ≤ 250 | 81 | ‐92 | 661 |
| 251 ‐ 500 | 96 | ‐27 | 61 |
| 501 – 1,000 | 96 | ‐24 | 65 |
| 1,001 – 1,500 | 98 | ‐9 | 45 |
| 1,501 – 2,000 | 99 | 5 | 45 |
| 2,001 – 4,000 | 100 | 33 | 110 |
| 4,001 – 8,000 | 99 | 53 | 38 |
| > 8,000 | 100 | 77 | 16 |
Multiple seasons of CSNT evaluation are warranted before altering a fertilizer N management program because the optimum N rate for a specific field can easily vary plus or minus 30 lb N/acre from season to season. Many factors affect the optimum N rate; including soil N supply, loss of N from the root zone, hybrid differences for N use, pest and weed impacts on N use, and the interaction of these and other factors. Thus the evaluation of a N management system with the CSNT (or any other N assessment tool) on any given field in a single season is interesting, but not particularly useful in making management decisions for future years. Unfortunately, there is no clear guidance on how many years the CSNT should be conducted, but three or more seasons are probably reasonable.
If end-of-season corn stalk NO3-N concentrations are consistently less than 250 ppm or more than 2,000 ppm one might consider conducting N response strip trials to identify the optimum N rate, rather than rely solely on the CSNT to alter the current N management program. Guidelines for conducting field-scale N response trials are available online (Nielsen and Camberato, 2011).
Recent research suggests the current interpretations of optimal and excessive N may be incorrect when fall-applied manure is the N source. Results of 52 trials with fall-applied manure showed that when corn stalk NO3-N was 3,500 ppm or less there was a greater than 50% probability of having had a profitable response to additional N (Kyveryga and Blackmer, 2013). Conducting strip trials to assess N response in manure-based N management programs would definitely be encouraged in light of these findings.
We gratefully acknowledge the support provided for these trials by the Indiana Corn Marketing Council, Pioneer Hi‐Bred Int’l and LG Seeds (seed contribution for Purdue trial sites), A&L Great Lakes Labs (discounted analysis costs), individual farmers and crop consultants, Purdue Univ. Office of Ag Research Programs, and all of the Purdue Ag Center staff.
Interestingly this Iowa research with fall, spring, or sidedress fertilizer applications found a 50% probability of a response to additional N occurred at 500 ppm; well within the current interpretations used in Iowa and Indiana.
Beegle, D. and J. Rotz. 2009. Late season cornstalk nitrate test. Penn State Univ. Agronomy Facts 70. http://nmplans.net/LateSeasonCornstalkNitrateTest.pdf [URL accessed Sept 2014].
Binford, G.D., A.M. Blackmer, and N.M. El‐Hout. 1990. Tissue test for excess nitrogen during corn production. Agronomy Journal 82:124‐129
Brouder, Sylvie. 2003. Cornstalk testing to evaluate the nitrogen status of mature corn: Nitrogen management assurance. Purdue University Coop. Ext. publication AY‐322‐W. http://www.agry.purdue.edu/ext/pubs/AY‐322‐W.pdf [URL accessed Sept 2014].
Camberato, J., R.L. (Bob) Nielsen, and B. Joern. 2014. Nitrogen management guidelines for corn in Indiana. J. Camberato, R.L. Nielsen, and B. Joern. Applied Crop Research Update, Purdue Univ. Agronomy Dept. http://www.kingcorn.org/news/timeless/NitrogenMgmt.pdf [URL accessed Sept 2014].
Fox, R.H., W.P. Piekielek, and K.E. Macneal. 2001. Comparison of late‐season diagnostic tests for predicting nitrogen status of corn. Agronomy Journal 93:590–597.
Kyveryga, Peter and Tracy M. Blackmer. 2013. 4R management: Differentiating nitrogen management categories on corn in Iowa. Better Crops/Vol. 97 (No. 1) 4‐6. http://goo.gl/uYLRgR [URL accessed Sept 2014].
Nielsen, Bob and Jim Camberato. 2011. Purdue On‐Farm Nitrogen Rate Trial Protocol.
Agronomy Dept, Purdue Univ. http://www.agry.purdue.edu/ext/ofr/protocols/PurdueNTrialProtocol.pdf [URL accessed Sept 2014].
The Purdue Plant and Pest Diagnostic Lab (PPDL) identified tar spot this week on a sample submitted from Carroll county. This is the first confirmation of the disease in Indiana in 2016. The disease was present in seven counties in Indiana, and 13 counties in Illinois in 2015. Illinois has also confirmed the disease this year, and a report on their findings can be read here: http://bulletin.ipm.illinois.edu/?p=3726.
Symptoms of tar spot begin as oval to irregular bleached to brown lesions on leaves in which black spore-producing structures called ascomata form. These structures protrude from the leaf surface, giving the symptomatic areas of the leaf a rough or bumpy feel to the touch. The structures can densely cover the leaf, and may resemble the pustules present on leaves due to infection by rust fungi. Lesions with these ‘bumpy’ ascomata may coalesce to cause large areas of blighted leaf tissue, which can be mistaken for saprophytic growth on dead leaf tissue (Figure 1). Symptoms and signs of tar spot can also be present on leaf sheaths and husks.
The economic importance of the disease in the U.S. is still unknown. However, it is important to alert Extension specialists if you observe the disease in 2016 so we can document distribution in the state. If you suspect you have tar spot, please submit samples to the PPDL for accurate diagnosis. More information on sample submission can be found here: https://www.ppdl.purdue.edu/PPDL/samples.html
More information on tar spot can be found in Purdue Extension Bulletin BP-90-W: Tar Spot: https://www.extension.purdue.edu/extmedia/BP/BP-90-W.pdf.
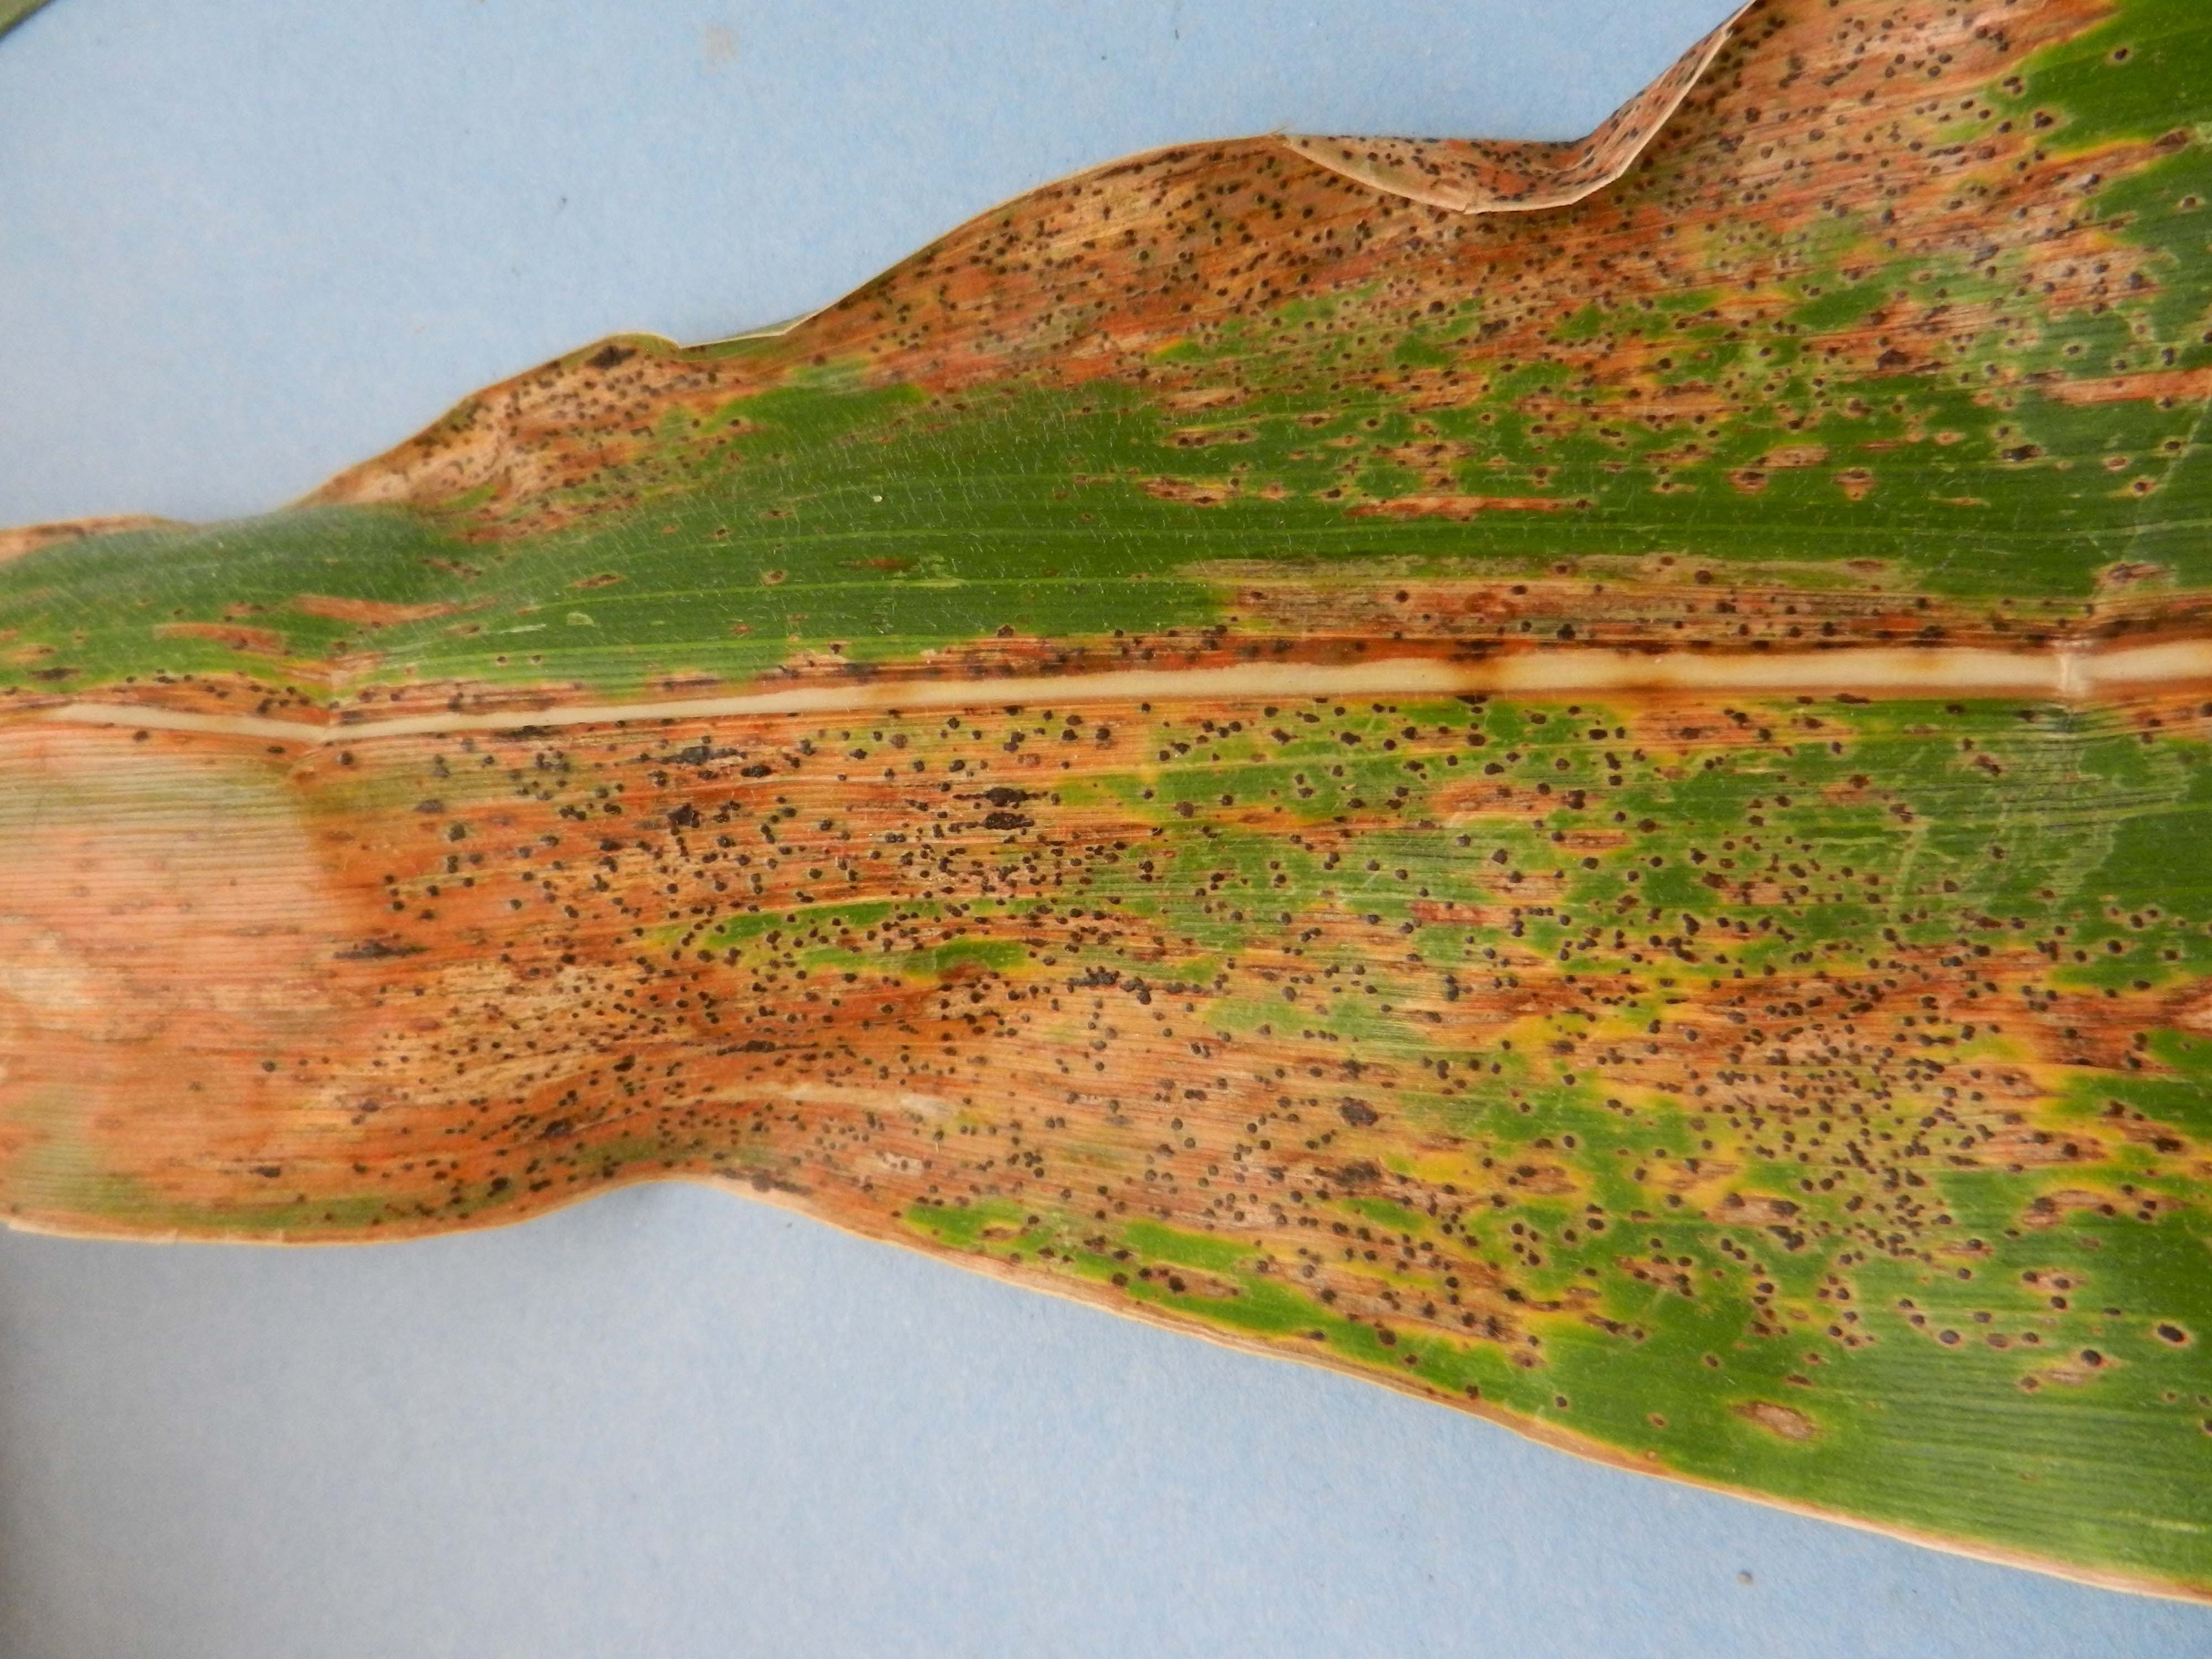
Figure 1. Symptoms and signs of tar spot include brown lesions and black fungal structures.
A variety of ear rots have been observed across Indiana. We reported on the prevalence of Diplodia and Trichoderma ear rots in an earlier Pest and Crop article that can be viewed here: https://extension.entm.purdue.edu/pestcrop/2016/Issue21/#3. Along with Diplodia and Trichodema, Gibberella and Fusarium ear rots have also been observed in the state. As harvest begins, it is important to identify fields that may have ear rots to ensure timely harvest, proper storage of moldy grain, and determine the potential for mycotoxin issues.
Regardless of which ear rot is present in a field, farmers should scout fields prior to harvest and determine the level of incidence of any ear rot in the field. If ear rots are observed in a field, affected areas should be harvested early and grain segregated to avoid contamination of non-infected grain. Grain harvested with suspected ear rots should be dried to below 15% moisture. If grain is stored above this moisture content, mold can continue to grow, and any mycotoxins present can continue to accumulate in grain. All grain contaminated by any ear rot fungus should be stored separately from good grain, and if stored long term, it should be stored below 13% moisture to prevent further growth of fungi.
Purdue has contributed to five new publications that are available through the Crop Protection Network website: http://cropprotectionnetwork.org/corn-diseases/. These publications provide information on ear rot identification and management, as well as answers to frequently asked questions about mycotoxins, and storing moldy grain.
More resources on corn ear rots as well as links to these new publications can be found on the following website: http://www.cornmycotoxins.com.Recently there has been increased interest in utilizing cover crops in our corn and soybean production systems because of government sponsored cost share programs and soil health benefits. Concurrently, there has also been increased utilization of soil residual herbicides in our corn and soybean production systems to help manage herbicide resistant weeds such as marestail, pigweeds, and ragweeds. Soil residual herbicides can remain active in the soil for anywhere from weeks to months after application. The length of time a residual herbicide remains biologically active in the soil is influenced by soil type, soil pH, organic matter, rainfall, and temperature. Since these factors will vary from field to field, definitive time intervals of residual herbicide activity can be difficult to predict.
A significant challenge has arisen because use of residual herbicides in our corn and soybean production systems may interfere with establishment of fall seeded cover crops. An unfortunate coincidence is that many of the crops being used for cover crops were not evaluated for herbicide carryover when field research was being conducted for support of the EPA label of the respective herbicide. As a result, data are lacking regarding rotational intervals for establishment of many cover crop species.
Over the last couple of growing seasons we have established experiments designed to evaluate the impact of commonly used residual herbicides on the establishment of many cover crop species. In addition, our colleagues in adjacent states have conducted similar research and we feel like we have a better handle on this topic now than we did two or three years ago. As was mentioned above, predicting herbicide persistence is complicated because so many different factors can influence herbicide dissipation in the soil.
As a general rule, residual herbicides that have activity on grass weeds can interfere with the establishment of some grass cover crop species, especially the smaller seeded ryegrass species. Residual herbicides from the group 2 (ALS), group 5 (triazine), group 14 (PPO), or group 27 (bleacher) can interfere with the establishment of some of the broad leaf cover crop species.
More specifically we have learned the following:
• Corn herbicides – Pyroxasulfone (Zidua) and metolachlor (Dual, etc) can hinder ryegrass establishment. – Atrazine or simazine at > 1 lb will be problematic for legumes and mustards unless lots of rain, < 0.75 lb/A may allow for most legume cover crops, mustards, and annual ryegrass, < 1 lb/A can allow cereal grain establishment – Mesotrione (Callisto, Lumax, Lexar etc.), flumetsulam (Python) and clopyralid (Stinger, Hornet, SureStart) can be problematic for legumes and mustards like canola and forage radish.
• Soybean herbicides –Chlorimuron (Classic, Canopy, Cloak, etc.), imazethapyr (Pursuit), and fomesafen (Reflex etc.) could be a problem for fall seeded legume or mustard covers including radish. However, establishment of cereal grains should be OK.
This summarizes our current knowledge on establishment of cover crops following the use of residual herbicides. The final two things to mention are that if you have questions about specific situations, one way to address the residual herbicide left in a field is to do a bioassay. Simply collect soil from the area you would like to seed the cover crop into and also from an area with a similar soil type, but no herbicide residue, and plant seed from the cover crop you would like to use. Observe growth for 3 weeks and if the plants look the same in the untreated and treated soil, you should be safe to plant to desired crop. Another consideration if you do not have time to do a bioassay is to plant a cover crop mixture. Cover crop establishment may be more reliable when mixtures of grass and broadleaf species are purchased and planted. Residual herbicides may interfere with establishment of some species in the mix, but have no effect on other species. The use of mixtures may allow more protection from complete failure due to herbicide residues in the soil. It would be important however to be sure that at least one or two of the species in the mixture is tolerant to the herbicides used in a specific field.
The harvest time can be a busy season. It is the time when growers hope that all their investments and efforts in nurturing their crops through the growing season reaches its full potential at maturity. Many things have to come together for the good of the crop, one of which is weather. And this year, we’ve been lucky to have good weather in the growing season, with a record forecast crop in the U.S. this year. Indiana corn yield is expected to reach 1.05 billion bushel this year, about 187 bushels per acre, up 37 bushels from 2015. Indiana soybean yield is expected to reach 312.4 million bushels at 55 bushels per acre up 5 bushels from 2015. With declining commodity prices, it is most likely that quite a lot of grain will be held in storage for a while.
It is important to note that the initial grain quality and moisture content dictates how long it should be held in storage. Harvesting timely and drying adequately to safe moisture content are two key decisions that could affect how well you will be able to manage your grain in storage. Because of the uncertainty in weather at harvest, it is usually best not to depend on field dry-down as your cost-saving strategy for reducing moisture content to safe levels. Frequent rains and warm weather, like we are currently experiencing could ruin a great crop. Rains reduce field dry-down rates of grain, and prevent combines and grain wagons from working on the field. It could also cause stalk rot development that can lead to weak stalks that lodge on the field. Lodged stalks will lead to harvest losses and contamination from soil. So it is important that you harvest timely and use an appropriate mechanical dryer to dry grain to a safe moisture.
The table below shows recommended maximum moisture content values for corn and soybean. It is important to note that storing beyond the following spring means that the grain will be held over the warm summer months. Therefore, factor in the exposure of grain to warm storage conditions in the warm summer months, which reduce grain storability. Dry grain down to moisture levels based on your long-term storage plan.
Maximum moisture contents for grain harvest and safe storage recommended in the Midwest.
Values for good quality, clean grain and aerated storage. Reduce safe storage moisture content by 1% for poor quality grain.
| Grain Type | Maximum Moisture Content, %wb | |||
|---|---|---|---|---|
| At Harvest | Storage Period | |||
| Up to 6 Months* | 6-12 Months** | > 1 Yr** | ||
| Shelled corn and grain sorghum |
30 | 15 | 13 | 13 |
| Soybeans | 18 | 13 | 12 | 11 |
*Up to 6 months from harvest refers to storage under winter conditions.
**6-12 months and >1 year storage refers to storage into the warm summer months.
Fines and trash provide harborage and a great environment for stored grain insect pests to thrive. Fines which are typically lodged at the center of the stored grain bulk in a bin will compact and cake over time due to various biological activities created by warm grain, insect pests and mold. This situation reduces airflow, which reduces the ability of the aeration fans to adequately cool the grain bulk. Ensure that you configure your combine setting to reduce trash intake and kernel breakage. Also, configure all handling equipment to prevent breakage during conveying. Operating conveyors such as screw conveyors full prevents kernel breakage. Also, using a cushion boxes at the dead-end of a downspout will prevent kernel to metal contact and breakage. In some cases, you might need to use a grain cleaner to remove fines, should they be excessive. By successively coring the center of the bin by pulling out grain during filling, fines at the center are reduced promoting adequate airflow that prevents caking, etc.
Cool adequately upon drying and after binning. Cooling grains to low winter temperatures as fast as possible will retard all biological activities that are detrimental to stored grain quality. Cooling stored grain to 40 degrees by December should be your goal. Ensure fans are ready for use and have been sized to deliver sufficient airflow, at least 0.1 CFM per bushel for bins in the Midwest with grain depths up to 21 feet, and 0.03 to 0.05 CFM per bu for large bins over 50ft depth. For a reference on aeration fans and sizing, refer to the MWPS-13 Midwest Plan Service Extension book on “Grain drying, handling and Storage. Another tool that is helpful is the University of Minnesota Fans Selection for Grain Bins web apps that can be accessed at http://webapps.bbe.umn.edu/fans/. The fans web app allows the user to enter bin and crop inputs, which estimates the fan horsepower requirements (hp) and allows the user to select fan type and arrangement (parallel or series) and view airflow and pressure for different depths of grain in the bin.
Lastly, be safe when working around grain bins (silos). Remember, a silo is a confined space and pose a hazard to personnel working inside silos. Follow recommended guidelines for safely working in grain silos. So while you enjoy the outdoors harvesting, enjoy it with the peace of mind that with proper planning and management your harvest will be safely secured till you are ready to sell.
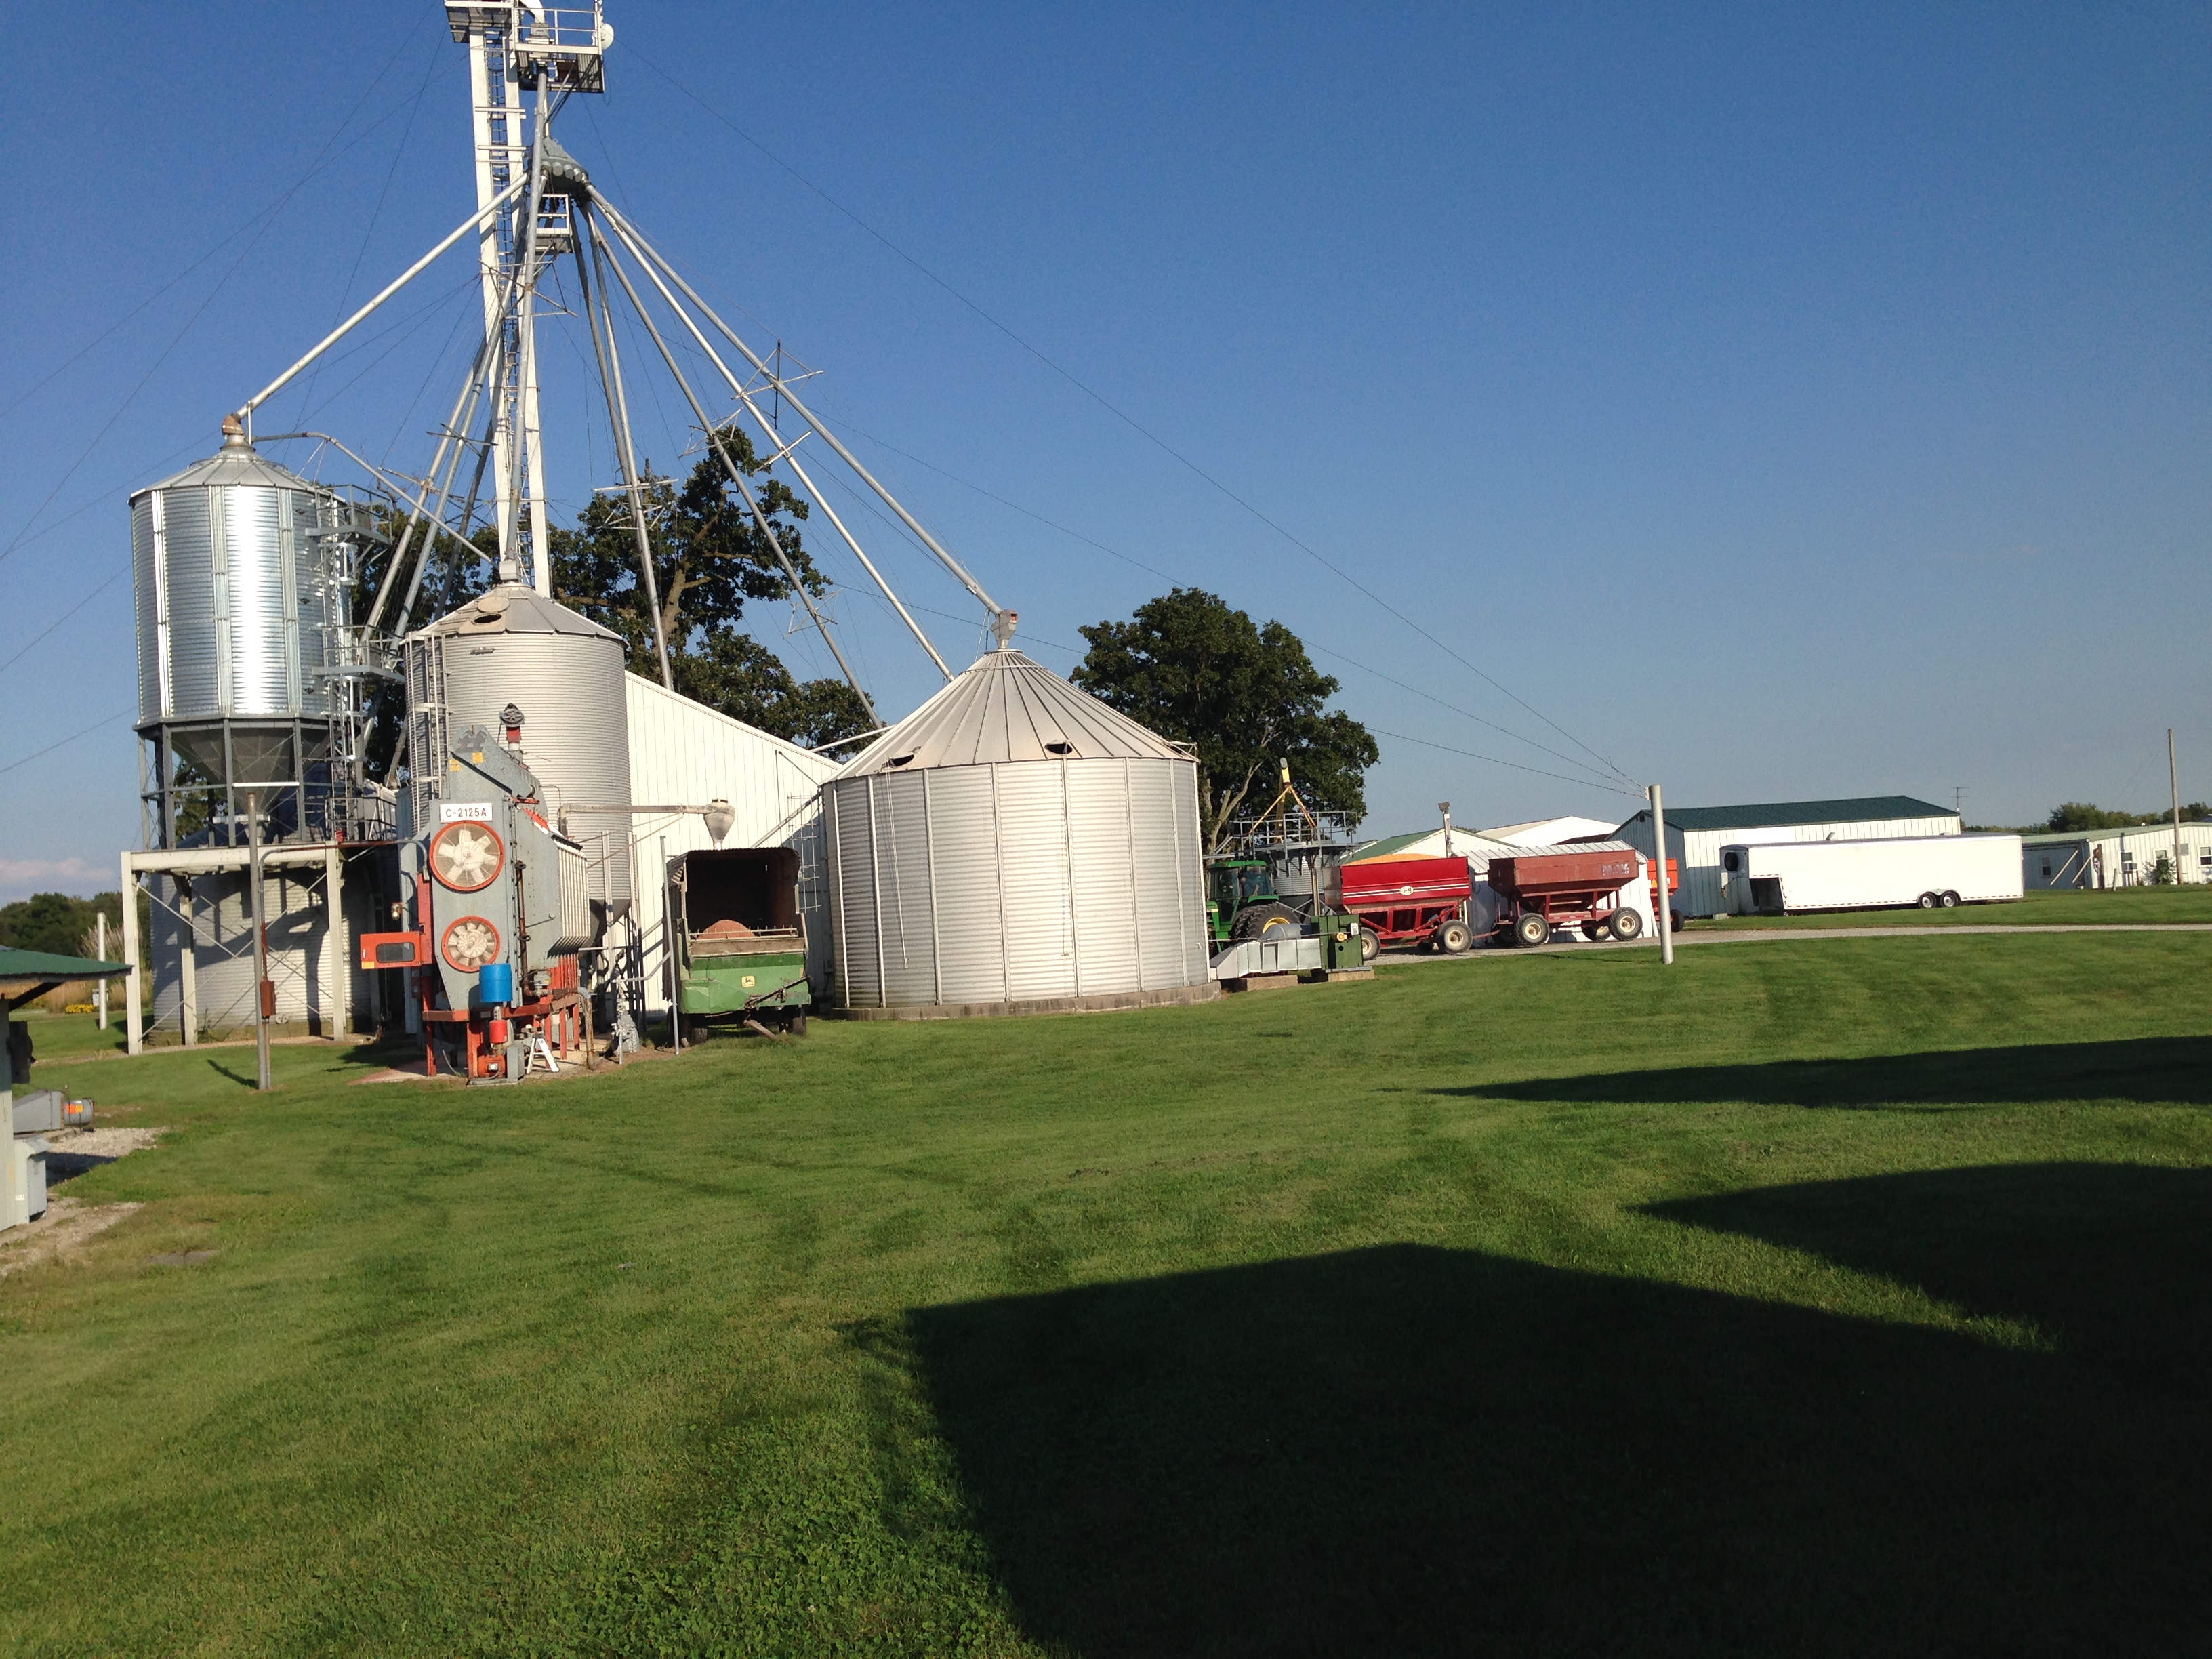
Grain bins.
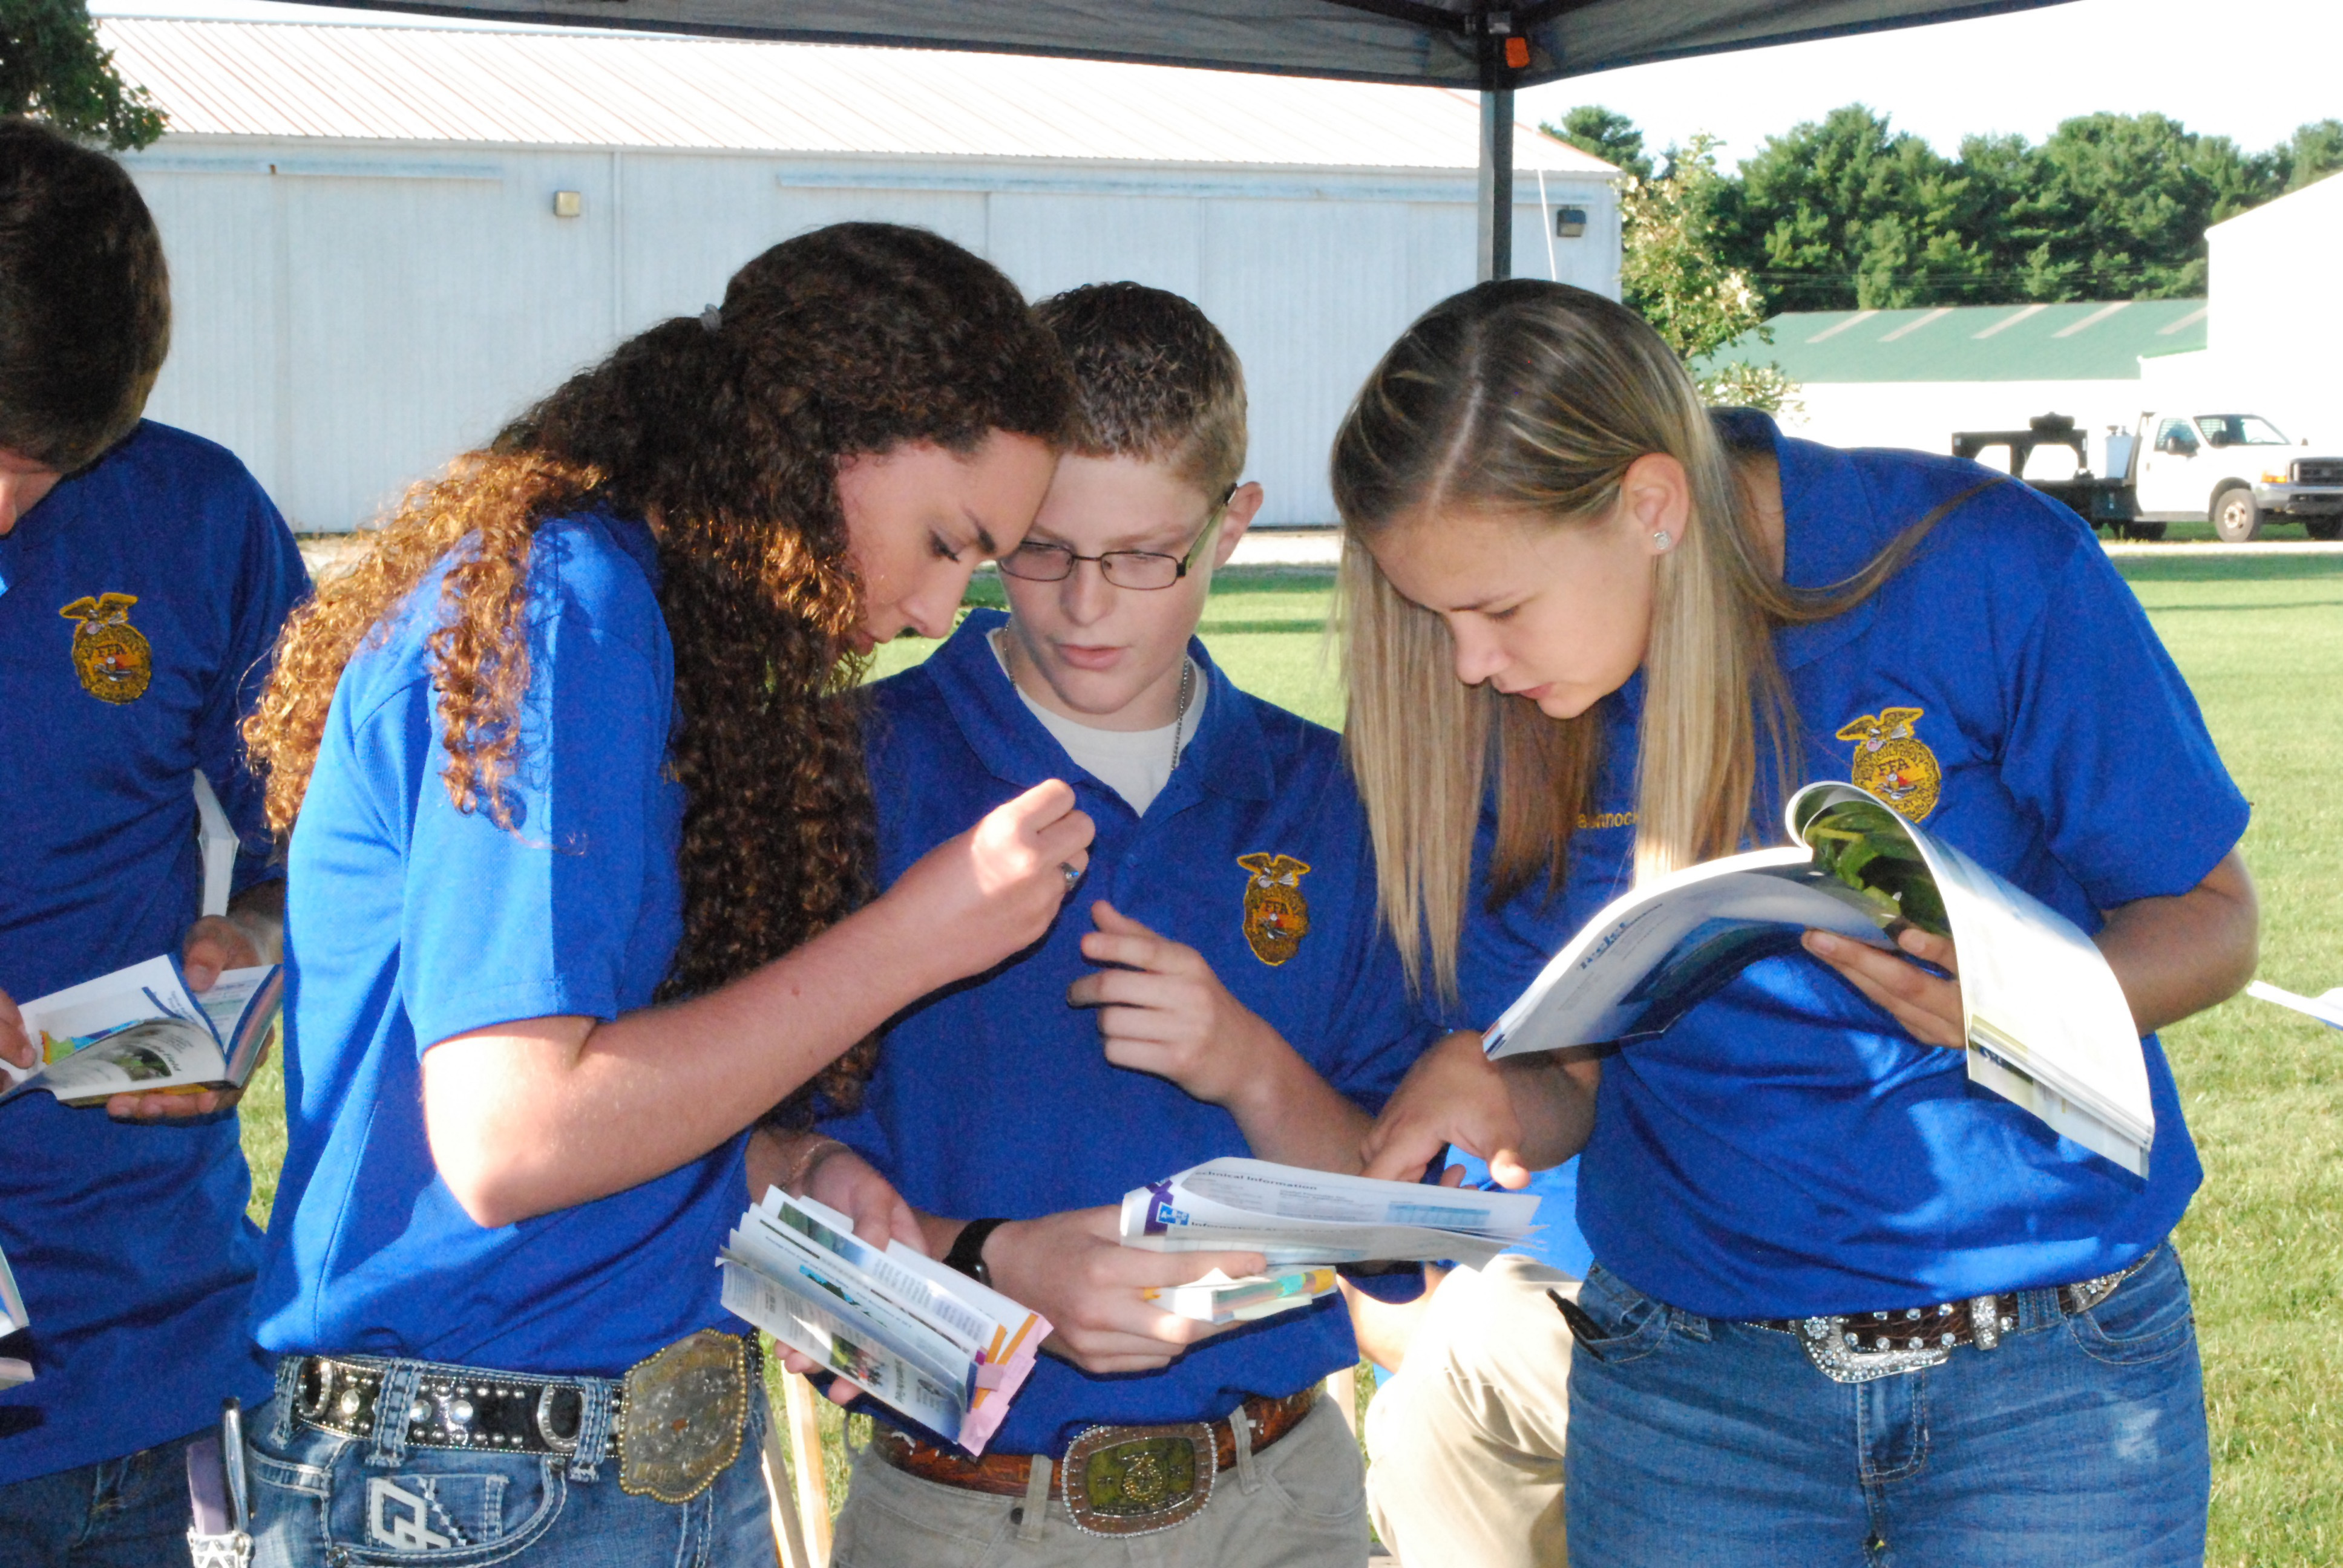
Eleven high school teams from throughout Indiana converged at the Purdue University Crop Diagnostic Training and Research Center last month to demonstrate their skills in Purdue’s annual crop scouting competition.
Crop scouting is the process of inspecting field crops for disease, pests or weeds, as well as monitoring plant growth and the effectiveness of pesticides or fertilizers.
The Southwestern High School Future Farmers of America (FFA) team, of Shelbyville, took top honors in the Purdue round, winning $500 and a commemorative plaque. South Central High School FFA of Union Mills placed second and won $300, and Eastern Hancock High School FFA of Charlottesville took third place and $150.
Southwestern FFA and South Central FFA advanced to take on teams from Iowa and Nebraska at the first regional championship on Aug. 31 at Iowa State University, where South Central FFA placed third. The championship is the only one of its kind in the country.
The Purdue-hosted event began three years ago and is organized by the departments of botany and plant pathology and agronomy. Sponsors are the Indiana Corn Marketing Council, the Indiana Soybean Alliance, Dow AgroSciences, DuPont Pioneer, Ceres Solutions, Beck’s Hybrids, and Weaver Popcorn, which also provided popcorn to the participants.
Primarily representing school agriculture and FFA clubs, some of the teams trained throughout the summer to prepare for the event, said Anna Freije, a Purdue Extension plant pathologist who helps organize the contest.
“We regularly hear from both students and coaches that this is one of their favorite competitions and they’re excited to be here,” said Freije. “They go home each year eager to prepare for the next one, and that’s a great thing for an organizer to hear.”
The event consists of nine stations, each of which contains materials for the students to examine and questions for them to answer. Their answers are judged by a Purdue Extension specialist or graduate student. The teams can earn up to 20 points per station. The team with the most points at the end wins.
In addition to testing their skills, the students can talk with the Extension specialists and learn about careers in agriculture, as well as crop scouting, Freije said.
“By working together, talking with the specialists and working with the Purdue corn and soybean field guides just like farmers in the field do, students are using real-life applications to solve problems,” Freije said. “And the interaction with the specialists is great because they see that they can specialize in weed science, or plant pathology, or entomology in their careers.”
Freije added that, while the organizers hope to make space for more teams in the coming years, they will make it a priority to preserve the personal, interactive approach that allows interaction between the students and station judges. “This is a competition, but it’s really meant to be a learning experience, too,” she said.
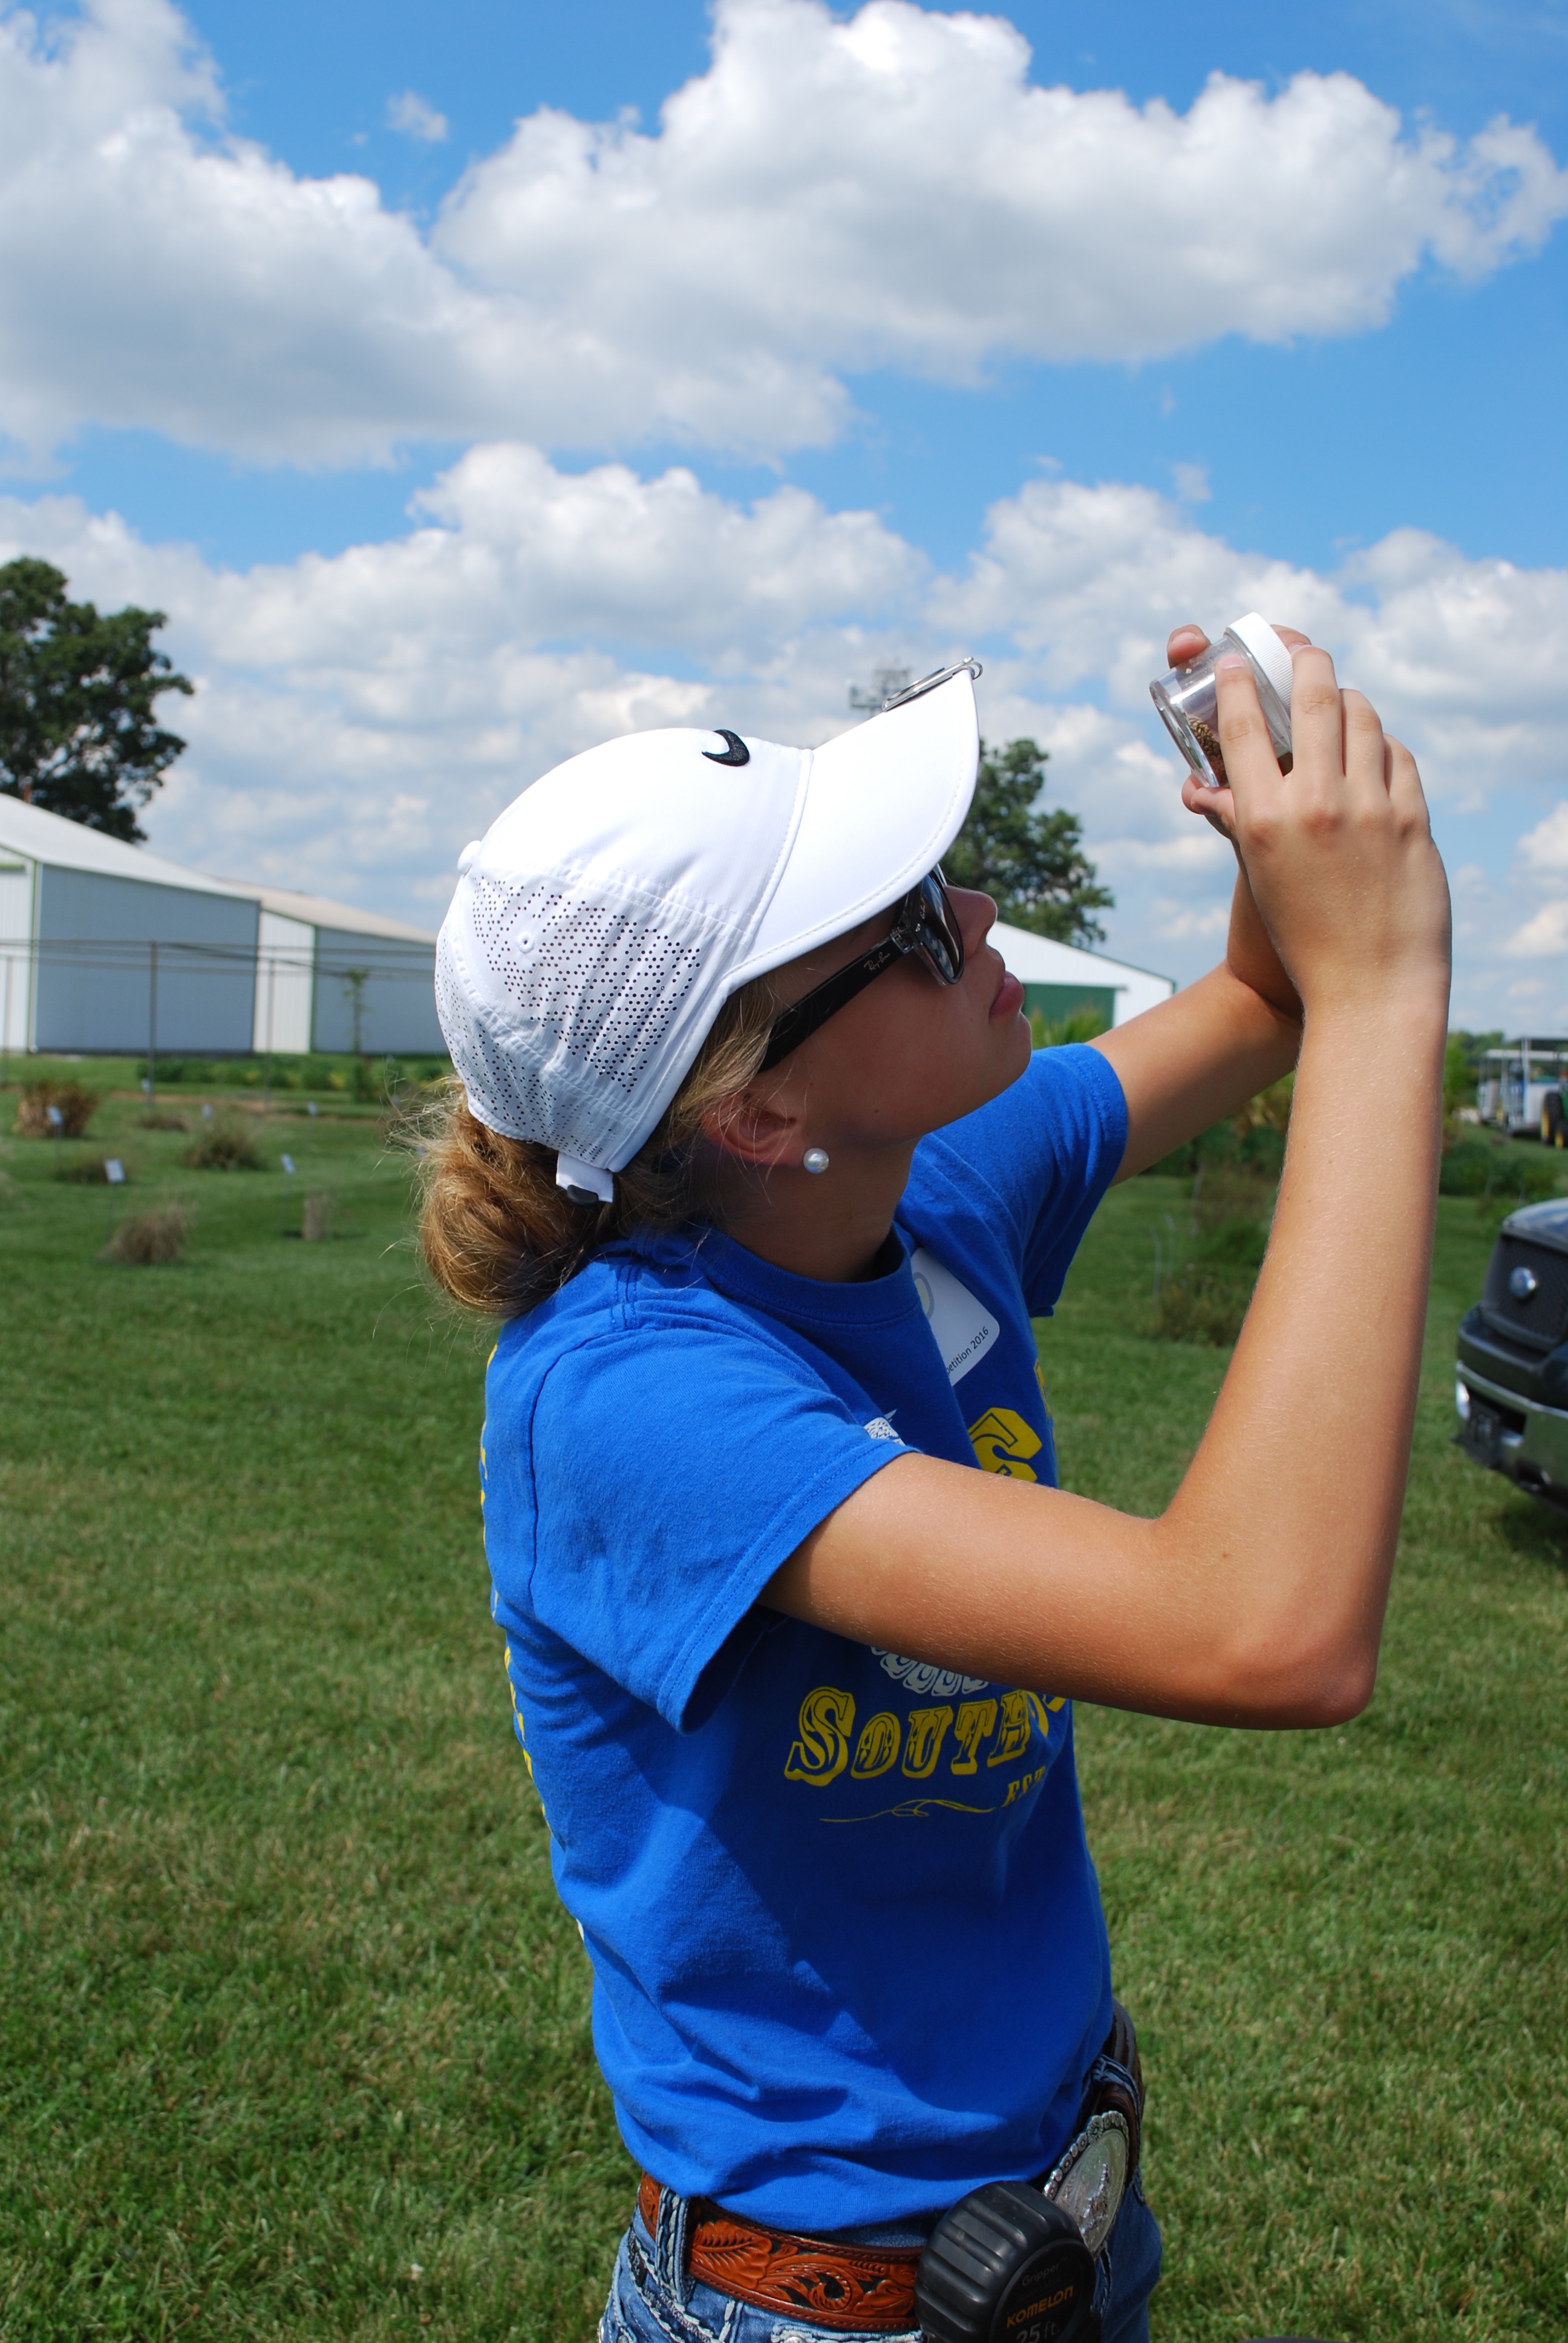
Insects on cover crops.
Trying to make an identification.
Dear Pest&Crop reader, your input on the following survery will help us gauge the value of this newsletter to you and to make any improvements needed. It will only take a few moments to complete, and it will help us to justify our effort to produce this weekly publication. This survey is voluntary and anonymous. All information collected is confidential and no hidden tracking of individual responses is being used. Won't you please take a few minutes to give us your feedback? Thank you!
Purdue Cooperative Extension Service
Purdue Extension Entomology
901 W. State Street
West Lafayette, IN, 47907
(765) 494-8761
luck@purdue.edu
@PurdueExtEnt
PurdueEntomology
![]()
If you would like to be alerted by e-mail when the current issue of the Pest&Crop is available on-line, please enter your e-mail address and click the submit button.
It is the policy of the Purdue University Cooperative Extension Service that all persons have equal opportunity and access to its educational programs, services, activities, and facilities without regard to race, religion, color, sex, age, national origin or ancestry, marital status, parental status, sexual orientation, disability or status as a veteran. Purdue University is an Affirmative Action institution. This material may be available in alternative formats.