Pest & Crop
Newsletter
Purdue Cooperative Extension Service
Purdue Cooperative Extension Service
Issue 21, August 21, 2015 • USDA-NIFA Extension IPM Grant
CLICK HERE FOR A PDF VERSION OF THIS ISSUE ![]()
For the last couple of years, we’ve had reports of noticeable populations of green stink bug in southwestern Indiana soybean fields. Some suspected damaged pods were sent to the Purdue Plant and Pest Diagnostic Lab for analysis during soybean harvest. Unfortunately, there was never conclusive evidence that stink bugs had damaged the pods and reduced seed size, e.g., reduced yield. This week, Larry Bledsoe, Entomology Field Research, sampled some southern Indiana soybean fields for an unrelated insect. However, what he found in a few fields at R5 growth stage, were large numbers of green stink bugs. He did emphasize that there was tremendous variability between fields. Although stink bugs are a key pest of soybeans in the southern US and South America, we don’t generally have treatable infestations this far north.
The green stink bug,a native of North America, is a flattened, shield-shaped bug, so named because of the offensive odor it produces. The adult is bright green and about 2/3 inch long. It is easily distinguished by the triangular-shaped plate that partially covers its wings and the characteristic foul odor they give off when handled. The nymphs hatch from clusters of barrel-shaped eggs. They closely resemble the adults throughout their several nymphal stages. The nymphs, however, are wingless, black and red in color, and lack the triangular plate. Green stink bug may appear in soybean fields from mid July through harvest time. Often they are most numerous in the border rows next to weedy or wooded areas; border sprays are a suitable option for control in many cases.
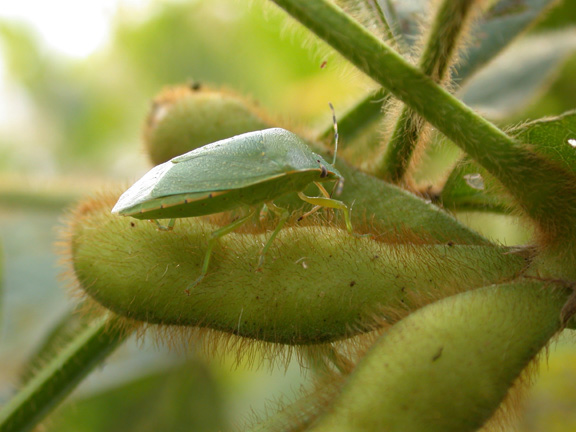
Green stink bug feeding on pod.
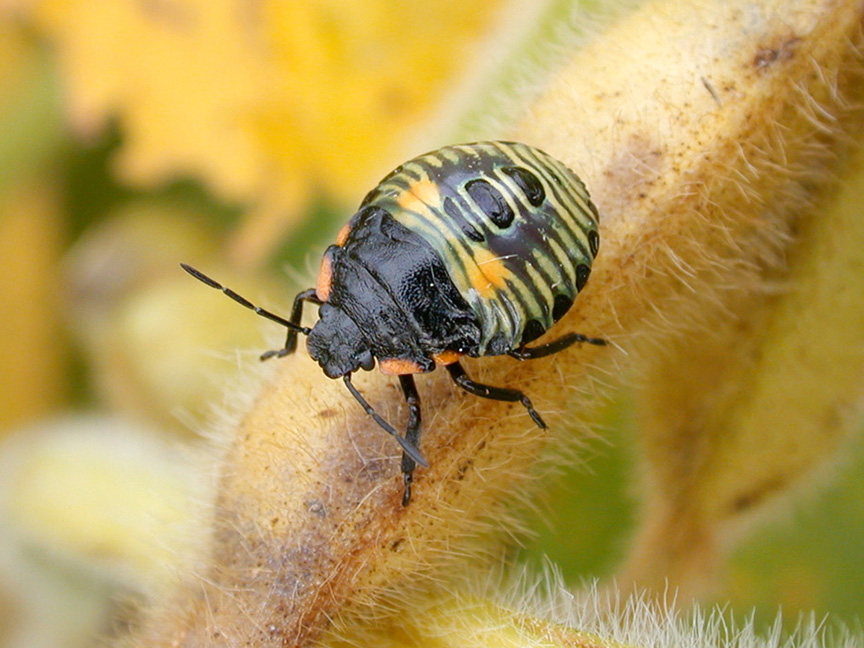
Green stink bug nymph.
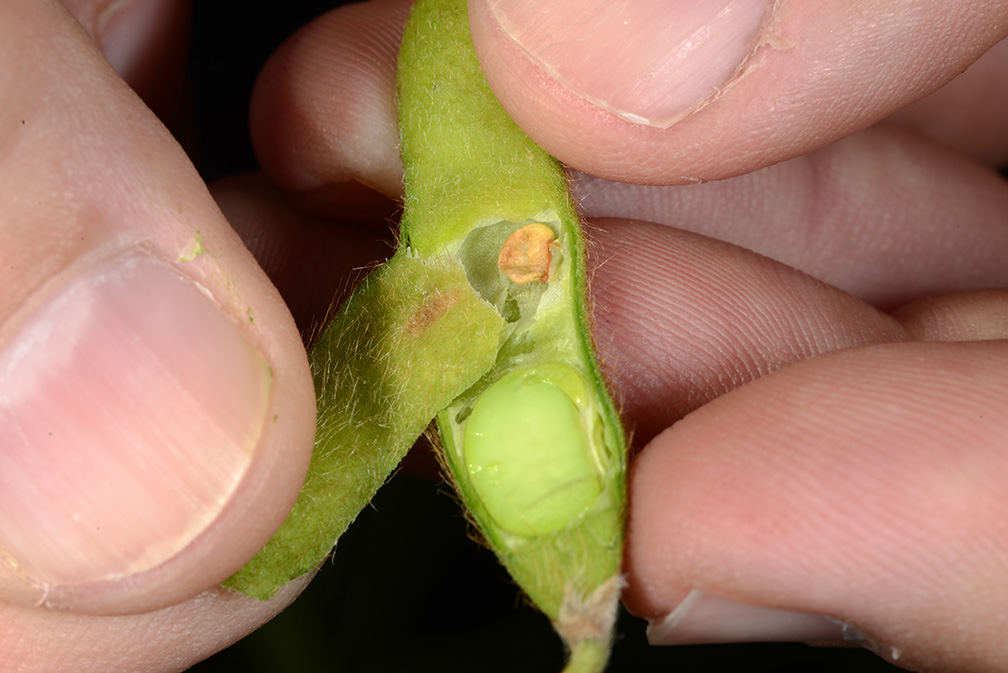
Stink bug damage to seed.
Both green stink bug adults and nymphs feed using their piercing-sucking mouthparts. They cause injury to soybean by puncturing pods and sucking fluid from the developing beans. This feeding also introduces bacteria, fungi and yeasts that may cause further damage. Seeds that do develop despite stink bug pod feeding may be smaller, shriveled, and/or discolored. This damage may lower bean quality, and ultimately reduce yields.
If stink bugs are found in a field after the pods have begun to form, take 20 sweeps with a sweep net in each of 5 field areas. Determine the average number of bugs per sweep. Control may be necessary if there are 40 stink bugs per 100 sweeps (0.4 bugs/sweep) and pods are still green.
Should treatment be justified, a list of recommended insecticides can be found HERE. Consider the “Pre-Harvest Interval” for each of the listed products.
Understand this one simple fact about yield monitors: They do not measure yield.
How's that for an opening statement?
What I want you to understand is that yield monitors ESTIMATE yield by converting electrical signals received from a mass impact or optical sensor in the clean grain elevator into ESTIMATES of grain flow (lbs) per second or two of travel time. Along with ESTIMATES of distance traveled (usually based on DGPS positions), header width, and ESTIMATES of grain moisture content... the yield monitor's firmware / software then CALCULATES "dry" grain yield per acre at a moisture content of your choice that are logged every second or two in the display's memory or uploaded by cellular connection to a Cloud-based Web server.
Yield monitor calibration involves a series of steps to ensure that the ESTIMATION of each of these factors is accurate. One of those steps involves the harvesting of calibration "loads" of grain that are used to "teach" the yield monitor's "black box" how to accurately convert the electrical signals from the sensors into ESTIMATES of grain flow rates.
The calibration "loads" should be harvested in such a way as to mimic the range of grain flow rates (i.e., the range of yield) you expect to encounter when harvesting a field. Ideally, each calibration load is calibrated at a different, but uniform grain flow rate. Some folks harvest strips at different speeds to accomplish this. Some folks harvest strips of varying widths (full header, 3/4 header, 1/2 header, etc.). In our field-scale nitrogen research trials where we have a wide range of N rate strips, our calibration loads typically come from 5 to 6 different N treatment rates because that often gives us a wide range of grain flow rates.
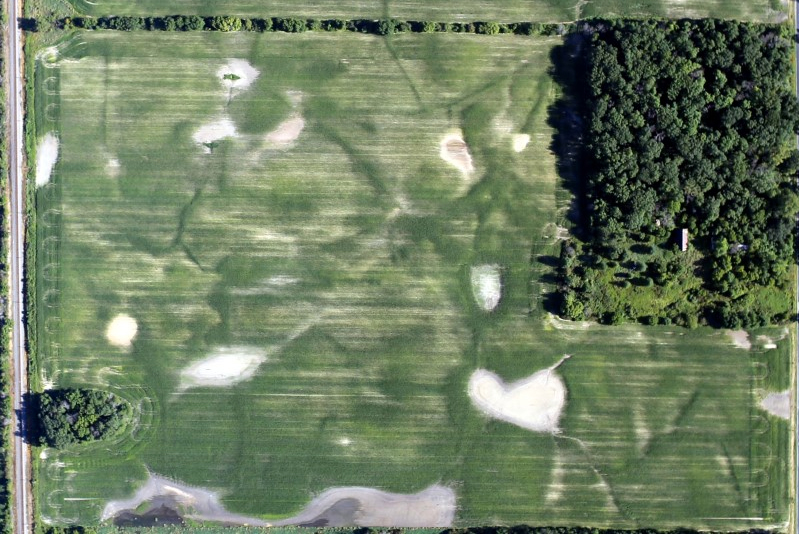
Variable growth of corn crop in early August due to excessive rainfall earlier in the growing season. Image source: Airscout.com.
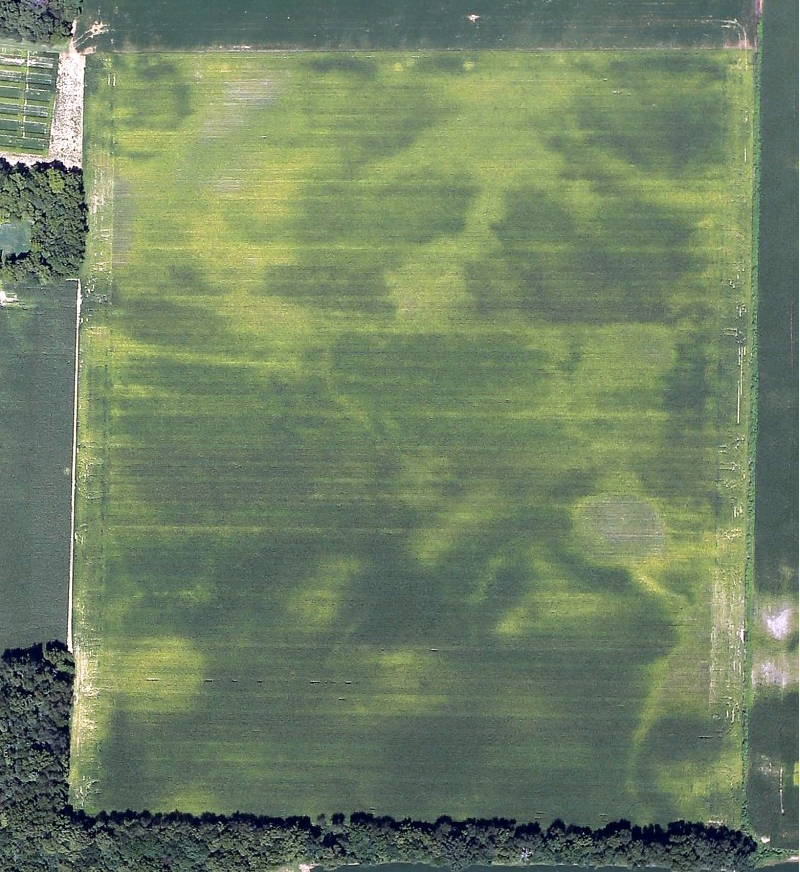
Variable growth of corn crop in early August due to early season excessive rainfall and late sidedress N application. Image source: Airscout.com.
The challenge this year in accurately calibrating grain flow estimates of yield monitors will be in those fields that suffered extensive damage from excessive rainfall early in the season. Yield will vary dramatically throughout such fields, maybe as great as 200 bushels per acre. It will be difficult to harvest calibration loads at uniform grain flow rates to obtain an accurate range of grain flow rates for yield monitor calibration. Similarly, grain moisture will vary dramatically within some fields where crop development was seriously delayed due to saturated soils or where areas were replanted. Combine moisture sensors can usually be adjusted to accurately estimate grain moisture content within a narrow range of moisture. However, it is my experience that moisture estimates become less accurate when the combine encounters hybrids or areas of fields with significantly different grain moistures. Inaccuracies in grain moisture estimates influence the accuracies of "dry" grain yield by the display.
The bottom line is that extra care and attention to details will be important when calibrating yield monitors this fall. Dig out that users guide for your yield monitor system NOW. Before the end of summer, devote some quality time to reading the sections on yield monitor calibration. Familiarize yourself with all aspects of yield monitor calibration. Attend a yield monitor workshop. Create your own checklist of calibration steps and follow them faithfully every time you calibrate the monitor. Do not forget the little things like vibration settings, header height stops, offset of the DGPS antenna, etc. Recognize that accurate weighing devices (grain carts, weigh wagons, farm scales) and moisture meters are crucial for the calibration of the monitor’s wet weight estimates and adjusting the combine’s moisture sensor readings.
And remember the old adage about computers… Garbage in equals garbage out.
Fancy colored yield maps are fine for verifying grain yields at the end of the harvest season, but bragging rights for the highest corn yields are established earlier than that down at the Main Street Cafe, on the corner of 5th and Earl. Some patrons of the cafe begin "eyeballing" their yields as soon as their crops reach "roasting ear" stage. Some of the guys there are pretty good (or just plain lucky) at estimating yields prior to harvest, while the estimates by others are not even close to being within the proverbial ballpark. Interestingly, they all use the same procedure referred to as the Yield Component Method.
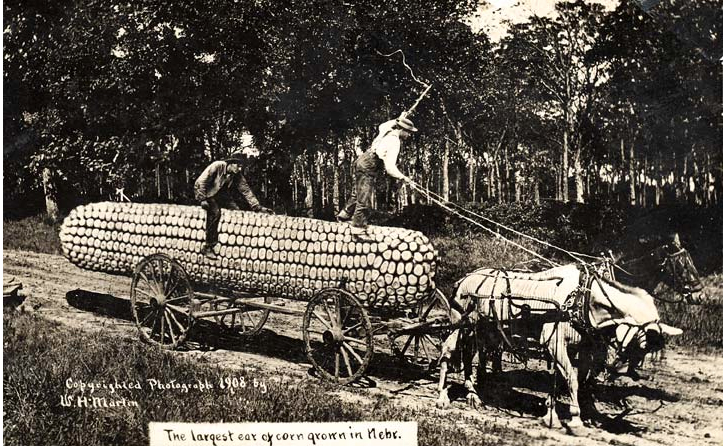
Largest ear of corn in Nebraska, ca. 1908. Courtesy of the Nebr. Historical Society.
Other pre-harvest yield prediction methods exist (Lauer, 2002; Lee & Herbek, 2005; Thomison, 2015), but the Yield Component Method is probably the most popular because it can be used well ahead of harvest; as early as the so-called "roasting ear" or milk (R3) stage of kernel development. Under “normal” conditions, the kernel milk stage occurs about 18 to 22 days after pollination is complete (Nielsen, 2013b). Estimates made earlier in the kernel development period risk being overly optimistic if subsequent severe stresses cause unforeseen kernel abortion (Nielsen, 2013a).
The Yield Component Method was originally described by the University of Illinois many years ago and is based on the premise that one can estimate grain yield from estimates of the yield components that constitute grain yield. These yield components include number of ears per acre, number of kernel rows per ear, number of kernels per row, and weight per kernel. The first three yield components (ear number, kernel rows, kernels/row) are easily measured in the field.
Final weight per kernel obviously cannot be measured until the grain is mature (kernel black layer) and, technically, at a grain moisture of 15% since that is the typical moisture value used to determine a 56-lb market bushel. Consequently, an average value for kernel weight is used as a proverbial "fudge factor" in the yield estimation equation. As first described many years ago, the equation originally used a "fudge factor" of 90, which represented 90,000 kernels per 56-lb bushel. In terms of how kernel weight is usually measured in research, this would be equal to about 282 grams per 1000 kernels.
Unfortunately, actual kernel weight among years or fields within years varies significantly and is influenced by both growing conditions and hybrid genetics. Kernel weight among hybrids can easily vary from less than 65,000 kernels per 56-lb bushel to more than 100,000 kernels per 56-lb bushel. Year to year variability for kernel weight for the same hybrid easily varies by upwards of 20,000 kernels per bushel simply due to variability in growing conditions during the grain filling period.
Crop uniformity also influences the accuracy of any yield estimation technique. The less uniform the field, the greater the number of samples that should be taken to estimate yield for the field. There is a fine line between fairly sampling disparate areas of the field and sampling randomly within a field so as not to unfairly bias the yield estimates up or down.
TIP:
For other row spacings, divide 43,560 by the row spacing (in feet) and then divide that result by 1000 (e.g., [43,560/2.5]/1000 = 17.4 ft).
TIP:
Do not count dropped ears or those on severely lodged plants unless you are confident that the combine header will be able to retrieve them.
TIPS:
Do not sample nubbins or obviously odd ears, unless they fairly represent the sample area. If row number changes from butt to tip (e.g., pinched ears due to stress), estimate an average row number for the ear. Don't count the extreme butt or tip kernels, but rather begin and end where you perceive there are complete "rings" of kernels around the cob. Do not count aborted kernels. If kernel numbers are uneven among the rows of an ear, estimate an average value for kernel number per row.
EXAMPLE:
For five sample ears with 480, 500, 450, 600, and 525 kernels per ear, the average number of kernels per ear would be (480 + 500 + 450 + 600 + 525) divided by 5 = 511.
Example:
Let's say you counted 30 harvestable ears at the first thousandth-acre sampling site. Let's also assume that the average number of kernels per ear, based on sampling every 5th ear in the sampling row, was 511. Using "fudge factor" values of 75, 85, and 95; the estimated range in yield for that sampled site would (30 x 511) divided by 75 = 204, or divided by 85 = 180, or divided by 95 = 161 bushels per acre.
Repeat the procedure throughout field as many times as you deem to be representative. Tally and average the results separately for each "fudge factor" used for the calculations.
Remember that this method for estimating pre-harvest grain yield in corn indeed provides only an estimate. Since kernel size and weight will vary depending on hybrid and environment, this yield estimator should only be used to determine “ballpark” grain yields. Yield can easily be overestimated in a year with poor grain fill conditions (e.g., low kernel size and weight from a drought year) and underestimated in a year with excellent grain fill conditions (e.g., larger kernel size and weight from non-stress grain fill periods).
Recognize that the Yield Component Method for estimating corn grain yield is probably only accurate within plus or minus 20 bushels of the actual yield. Obviously, the more ears you sample within a field, the more accurately you will "capture" the variability of yield throughout the field. Use the yield estimates obtained by this method for general planning purposes only.
The Pro Farmer division of Farm Journal Media sponsors an annual Midwest Crop Tour that sends out teams of "scouts" to visit corn fields throughout the Midwest to estimate yields. The method used in that effort is a variation of one described years ago by University of Minnesota agronomist Dale Hicks (now Professor Emeritus) that combines the use of several yield components (ears per acre and kernel rows per ear) with a measurement of ear length (a proxy for kernel number per row).
The focus of the crop tour is not to necessarily estimate the yields of specific fields, but rather to more broadly estimate the yield potential within regions of the Midwest, so one probably should exercise caution in using this method for estimating yields within an individual field. Nevertheless, folks who have heard about the Pro Farmer Tour may be interested in trying the method themselves, so here are the steps involved with the Pro Farmer method (Flory, 2010; Mick, 2013). I would certainly suggest that these steps be repeated in several areas of an individual field because of natural spatial variability for yield.
Example:
30 inchesTip:
For subsequent yield estimates within the field, I would suggest walking even further into the field and crossing over multiple planter passes to sample different areas of the field.Example:
(42 ears in one row + 45 ears in other row) divided by 2 = 43.5
Tip:
Frankly, I would suggest harvesting up to 5 ears from each of the two adjacent rows to better sample the area and minimize the effect that one oddball ear could have on the calculated average ear lengths and kernel row numbers.
Example:
(6 inches + 7 inches + 5 inches) divided by 3 = 6
Example:
(16 rows + 14 rows + 16 rows) divided by 3 = 15.3
Example:
(43.5 ears x 6 inches x 15.3 rows) divided by 30-inch rows = 133 bu/ac yield estimate
Flory, Chip. 2010. Crop Tour Insider. Pro Farmer, Farm Journal Media. [Originally online, but no longer accessible. See Mick, 2013].
Lauer, Joe. 2002. Methods for Calculating Corn Yield. Agronomy Advice, Univ. of Wisconsin-Madison. Online at http://corn.agronomy.wisc.edu/AA/pdfs/A033.pdf [URL accessed Aug 2015].
Lee, Chad and Jim Herbek. 2005. Estimating Corn Yields (AGR-187). Univ. of Kentucky. Online at http://www.ca.uky.edu/agc/pubs/agr/agr187/agr187.pdf. [URL accessed Aug 2015].
Mick, Katie. 2013. How the Crop Tour Arrives at Yield Estimates. DTN/Progressive Farmer. http://goo.gl/ADmbYt [URL accessed Aug 2015].
Nielsen, R.L. (Bob). 2011. Kernel Set Scuttlebutt. Corny News Network, Purdue Univ. Online at http://www.kingcorn.org/news/timeless/KernelSet.html [URL accessed Aug 2015].
Nielsen, RL (Bob). 2012. Opportunities to Assess Yield Potential of Drought-Stressed Corn. Corny News Network, Purdue Extension. Online at http://www.kingcorn.org/news/articles.12/YldAssessment-0727.html [URL accessed Aug 2015].
Nielsen, R.L. (Bob). 2013a. Effects of Stress During Grain Filling in Corn. Corny News Network, Purdue Univ. Online at http://www.kingcorn.org/news/timeless/GrainFillStress.html [URL accessed Aug 2015].
Nielsen, R.L. (Bob). 2013b. Grain Fill Stages in Corn. Corny News Network, Purdue Univ. Online at http://www.kingcorn.org/news/timeless/GrainFill.html [URL accessed Aug 2015].
Thomison, Peter. 2015. Estimating Corn Yields . C.O.R.N. Newsletter, Ohio State Univ. Online at http://corn.osu.edu/newsletters/2015/2015-25/estimating-corn-yields [URL accessed Aug 2015].
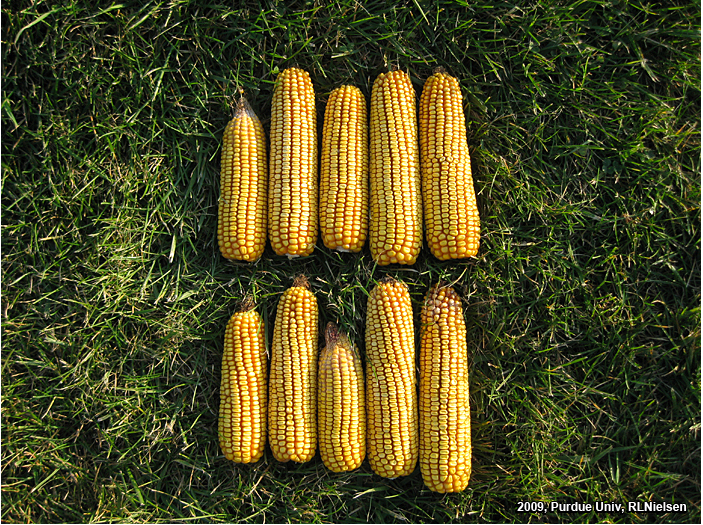
Random samples of ears.
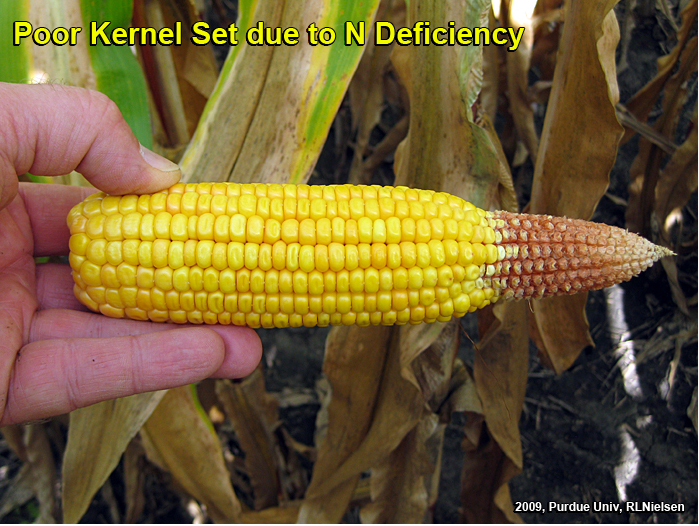
Poor tip fill due to N deficiency.
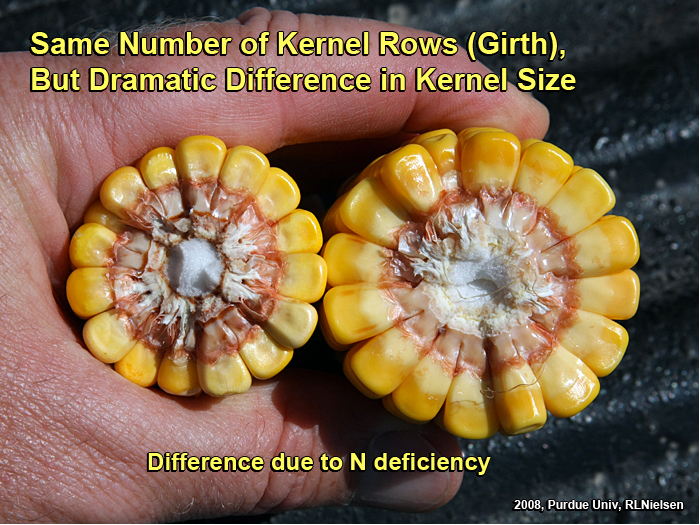
Kernel size differences due to N deficiency.
Purdue Cooperative Extension Service
Purdue Extension Entomology
901 W. State Street
West Lafayette, IN, 47907
(765) 494-8761
luck@purdue.edu
@PurdueExtEnt
PurdueEntomology
![]()
If you would like to be alerted by e-mail when the current issue of the Pest&Crop is available on-line, please enter your e-mail address and click the submit button.
It is the policy of the Purdue University Cooperative Extension Service that all persons have equal opportunity and access to its educational programs, services, activities, and facilities without regard to race, religion, color, sex, age, national origin or ancestry, marital status, parental status, sexual orientation, disability or status as a veteran. Purdue University is an Affirmative Action institution. This material may be available in alternative formats.