Pest & Crop
Newsletter
Purdue Cooperative Extension Service
Purdue Cooperative Extension Service
Issue 12, June 18, 2015 • USDA-NIFA Extension IPM Grant
CLICK HERE FOR A PDF VERSION OF THIS ISSUE ![]()
2015 is proving to be a perfect example of how environmental extremes can have serious detrimental effects on insect pests. Simply stated…insects breathe air and therefore can drown! This year’s wild swings in moisture and temperature are not unique to Indiana alone, as most Midwestern states are experiencing the same. This has implications for a key pest across the region, the western corn rootworm.
How is corn rootworm larval survival impacted by saturated soils? Rootworm adults have a tendency to lay eggs during late summer (when rain is often scarce) in areas where soil is moist and cooler than surrounding soil. These areas are typically found in soil types and field depressions that tend to collect and hold moisture in late summer. They will often use cracks in the soil to get deeper into the profile. This is why larval injury the following year tends to be clumped and not uniform throughout the field. These same areas that are attractive to rootworm adults for egg laying are where soils tend to become saturated first and remain wet the longest when rain is extensive. Therefore, the impact of drenching rains on rootworm can be significant if the timing is correct. Over-wintering rootworm eggs don’t require much oxygen and are very resistant to flooding and fields would have to be submerged many days before adverse impact would occur. Newly hatched larvae, on the other hand, are particularly susceptible to saturated soil and will die after being denied air for a less than a day. As reported in last week’s Pest&Crop, larvae throughout most of the state starting hatching in late May to early June, just as rains have been saturating much of the state’s soil. Newly hatched larvae that are still embedded in roots will generally not survive in submerged or heavily saturated soil after a day or two. The warmer the soil, the more rapidly these stressed larvae die. In short, it’s a very bad week to be a rootworm in the Midwest. This is a bit of good news we can offer in this very challenging season!
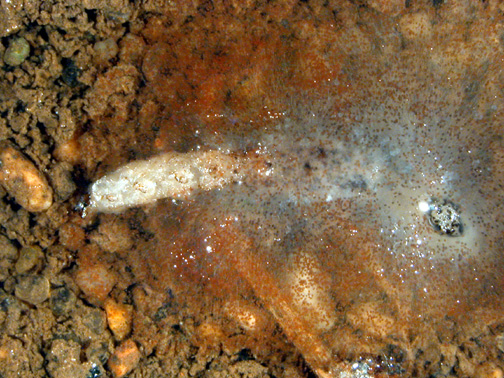
Drowned and diseased corn rootworm.
| County/Cooperator | Wk 1 | Wk 2 | Wk 3 | Wk 4 | Wk 5 | Wk 6 | Wk 7 | Wk 8 | Wk 9 | Wk 10 | Wk 11 | Wk 12 |
|---|---|---|---|---|---|---|---|---|---|---|---|---|
| Dubois/SIPAC Ag Center | 0 | 0 | 1 | 0 | 2 | 1 | 0 | 4 | 0 | 3 | 1 | |
| Jay/Davis Ag Center | 0 | 0 | 2 | 0 | 4 | 1 | 0 | 0 | 0 | 0 | 3 | |
| Jennings/SEPAC Ag Center | 0 | 0 | 0 | 0 | 1 | 0 | 0 | 2 | 4 | 0 | 3 | |
| Knox/SWPAC Ag Center | 0 | 0 | 0 | 1 | 0 | 0 | 2 | 3 | 1 | 1 | ||
| LaPorte/Pinney Ag Center | 0 | 0 | 3 | 0 | 17 | 35 | 29 | 5 | 0 | 11 | 87 | |
| Lawrence/Feldun Ag Center | 0 | 2 | 0 | 1 | 0 | 11 | 3 | 5 | 7 | 12 | 19 | |
| Randolph/Davis Ag Center | 0 | 0 | 0 | 0 | 0 | 0 | 0 | 0 | 0 | 0 | 6 | |
| Tippecanoe/Meigs | 0 | 0 | 1 | 0 | 0 | 0 | 0 | 0 | 0 | 0 | 2 | |
| Tippecanoe/Meigs (Hartstack) |
7 | 548 | 406 | 58 | 13 | 7 | 93 | 256 | ||||
| Whitley/NEPAC Ag Center | 0 | 1 | 5 | 2 | 17 | 25 | 4 | 0 | 5 | 3 | 9 | |
| Whitley/NEPAC Ag Center (Hartstack) | 792 | 404 | 137 | 103 |
Wk 1 = 4/2/15 - 4/8/15; Wk 2 = 4/9/15 - 4/15/15; Wk 3 = 4/16/15 - 4/22/15; Wk 4 = 4/23/15-4/29/15;
Wk 5 = 4/30/15-5/6/15; Wk 6 = 5/7/15-5/13/15; Wk 7 = 5/14/15-5/20/15; Wk 8 = 5/21/15-5/27/15;
Wk 9 = 5/28/15-6/3/15; Wk 10 = 6/4/15-6/10/15; Wk 11 = 6/11/15-6/17/15
A research update was recently published on Purdue’s Extension Crop Pathology webpage entitled Goss’s Wilt on Grass Hosts. Goss’s bacterial wilt and leaf blight of corn, is caused by the bacterium Clavibacter michiganensis subsp. nebraskensis (Cmn). It was confirmed in Indiana in 2008, and is an annual problem in field corn, popcorn, and sweet corn. The bacteria overwinter on host debris and infect susceptible hosts when rain or irrigation water splashes bacteria on to host tissue. Hosts include corn and sorghum as well as several common grass weeds such as shattercane and four different foxtail species. Recent research at Purdue University has found that the weedy grasses johnsongrass and large crabgrass, as well as the cover crop annual ryegrass, are also hosts of this bacterium. This research and publication development were funded by the Indiana Corn Marketing Council. This publication describes the signs and symptoms of Goss’s wilt on grass hosts and includes revised management recommendations for combating the disease in the field.
Excessive rainfall and the resulting ponding, flooding, or saturated soils have likely caused some loss of applied and soil-derived nitrogen (N). Nitrate-N (NO3-N) is the form of N most likely to be lost from the crop root zone, either to tile drainage, groundwater, and/or into the atmosphere (via denitrification). Ammonium-N (NH4-N) is not subject to N loss mechanisms when incorporated into the soil.
Most of the fertilizer or manure N added to soil is initially in forms other than nitrate. The exception is liquid N (28-32% N) which is only 25% NO3-N, the remainder is NH4-N (25%) and urea-N (50%). Anhydrous ammonia is 100% NH4-N when it reacts with water in the soil. Manure contains mostly organic-N and NH4-N forms.
Unfortunately, no matter what forms of N are added to the soil, all of them eventually convert to NO3-N. Time, temperature, soil type, N source, rate, and application method, and other factors determine how rapidly NO3-N appears. It is difficult to estimate the extent of NO3-N formation because of the many factors affecting N conversion, and their interaction. It is even more difficult to then estimate how much of the N converted to NO3-N was subsequently lost from the rootzone.
Soil sampling and measuring the concentration of NO3-N and NH4-N remaining in the rootzone is an alternative to guesstimating how much N was lost.
Take a good representative soil sample. Collect soil cores to a depth of at least 1 foot. Consider collecting a separate deeper soil sample from between 1 and 2 feet deep for a more complete assessment of plant available N, especially in sandy soils where leaching through the soil profile is the predominant form of N loss.
Each sample should represent no more than 10 acres. Where earlier-applied fertilizer N was broadcast rather than banded, collect 20 to 30 soil cores per sample. Where earlier-applied fertilizer N was banded (e.g., anhydrous ammonia), collect 15 to 20 soil cores using the sampling scheme illustrated in Figure 1.
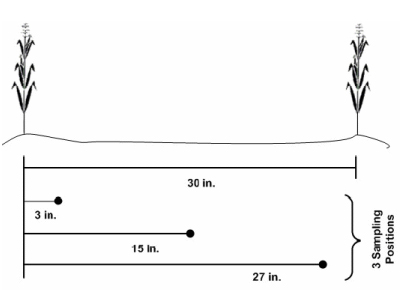
Figure 1. Recommended soil sampling pattern in relation to two corn rows when N fertilizer has been banded with the row. Always sample perpendicular to the direction fertilizer was applied. (Source of image: Brouder & Mengel, 2003).
Dry or refrigerate the soil samples as soon as possible to stop the soil microbes from altering the N levels. Spread the soil thinly on plastic to air dry and hasten drying with a fan if possible. If you choose to use an oven to dry the soil, keep the temperature below 250oF. Alternatively refrigerate the samples and keep them cold through shipping to the laboratory.
A list of certified soil testing laboratories is available at the following Web address. Most should offer soil N test analysis services, but contact them first to confirm. https://ag.purdue.edu/agry/extension/Pages/soil_testing.aspx.
Ammonium-N is just as available to plants as nitrate-N, but typically little accumulates in the soil because it is readily converted to nitrate under most conditions. However, if N fertilizer was recently applied, there may well yet be some ammonium N available in the soil for plant use.
Significant levels of soil ammonium are most likely if anhydrous ammonia was the N source, a nitrification inhibitor such as nitrapyrin or dicyandiamide (DCD) was used, and/or soil pH was low (below 5.5 ). In these situations, low levels of soil nitrate may indicate little conversion of ammonium to nitrate, rather than simply loss of nitrate.
TIP: When you submit the soil samples to the soil-testing laboratory, request analyses for exchangeable ammonium as well as for nitrate, particularly if anhydrous ammonia was applied relatively recently or a nitrification inhibitor was used with the N fertilizer.
If soil test values for ammonium and nitrate are reported as ‘ppm’ or ‘mg/L’ nitrogen (NH4-N or NO3-N), then calculate pounds per acre of available N by multiplying the test results by 4 when the sample depth was 1 foot. For other sample depths, divide the sample depth (in inches) by 3 and then multiply by the test results.
Example: Soil NO3-N in a 1-foot sample was 30 ppm.
Conversion from ppm to pounds per acre is (12 inches / 3) x 30 ppm = 120 pounds per acre.
If soil test values are reported directly as NH4 or NO3, then these values must be converted to an ‘N’ basis first. The calculations are: NH4-N = NH4 / 1.2 and NO3-N = NO3 / 4.5.
Example: Soil NO3 was reported to be 90 ppm.
Conversion from NO3 to NO3-N is 90 ppm NO3 / 4.5 = 20 ppm NO3-N.
In our opinion, soil nitrate and ammonium levels can be used to guide additional N applications to fields subjected to saturation and flooding. However, there are admittedly no hard and fast research-based recommendations for this particular situation.
The primary tool for soil N sampling in the Eastern Corn Belt has been the pre-sidedress soil nitrate test (PSNT) which is most applicable as an indicator of N availability in soils where manure had been applied or a legume such as clover or alfalfa had been plowed down (Brouder & Mengel, 2003). For these field situations, the level of soil nitrate found is considered an index of N availability, i.e., an indicator of how much N is currently available AND how much N may become available from the manure or organic matter. When used in this context, soil NO3-N levels greater than 25 ppm are thought to be adequate for optimum corn yield without the addition of more fertilizer N.
During the research that developed this soil test, sampling deeper than 1 foot or analyzing for exchangeable NH4-N did not increase the predictive ability of the PSNT enough to warrant the extra effort. However, when the intent is to assess the loss of N due to rainfall, we suggest that deeper sampling plus analysis for NH4-N content can provide useful information to help growers decide whether additional fertilizer N is merited. It is important to recognize that in this context, measurements of soil nitrate and ammonium following fertilizer N applications indicate current N availability only, because there is no manure- or legume-derived N to be released later in the season. Considering this fact, the commonly accepted 25 ppm NO3-N critical level for manure- or legume-N fertilized soils may be too low for soils that have only received fertilizer N.
Leaching of soil nitrate is expected with ponding, flooding, or soil saturation, but not all of the nitrate will have been moved below the root zone. A shortcoming of the 1-foot sampling depth is that it does not always reflect plant available N deeper in the profile, particularly when abnormal leaching occurs. This is why we suggest also sampling from the 1- to 2-foot depth for assessment of soil N availability, particularly in sandy soils.
In our on-going N rate trials conducted throughout the state, the “normal” background levels of soil N in the upper 1 foot of mineral soils typically range from 5 to 10 ppm NO3-N and 4 to 8 ppm NH4-N for corn grown in rotation with soybean or corn without manure- or legume-derived N. Typically the deeper 1- to 2-foot soil samples would have slightly lower N levels.
We suggest that the 25 ppm NO3-N critical level for manure- or legume-N fertilized soils may be too low for soils that have only received fertilizer N and where N loss conditions have been severe. Where enough rainfall has occurred to cause substantial N loss, we suggest this level of rain has depleted the lower soil profile as well as the upper foot of soil.
Table 1 lists estimates of expected soil NO3-N levels with different fertilizer rates assuming “normal” background levels of nitrate and ammonium at the time of fertilization and a “normal” amount of movement below the one foot sampling depth (approximately 1/3 of the fertilizer N is moved below the 1-foot sampling depth but retained within the root zone with normal rainfall). If the corn is healthy and the growing season typical from here on out, we would suggest applying no more than 10 pounds of N for every 2 ppm reduction in soil sample N below the expected levels listed in the table.
Recognize that as a healthy crop moves through the rapid growth phase prior to pollination, soil N levels will naturally decrease in response to rapid N uptake by the plants. However, by the time a healthy crop reaches the V9 leaf stage (about 30 inches tall), only 19 lbs/ac N (equivalent to 5 ppm soil NO3-N in a 1-foot deep sample) have typically been taken up the plants (Mengel, 1995). But, by the time a healthy crop reaches shoulder-high (~ V15 or 60 inches tall), approximately 116 lbs/ac N (equivalent to 29 ppm soil NO3-N in a 1-foot deep sample) have been taken up by the plants. With later corn the amount of N in the plant should be considered when evaluating soil N.
The following examples give you an idea of how the tabular information may be used to make this decision.
Example calculation when only NO3-N is determined:
Fertilizer N was applied at 160 pounds of N per acre in early April as 28% UAN in southern Indiana. Only soil NO3-N analysis was requested because it was assumed that most of the urea- and ammonium-N had been converted to nitrate since temperatures were warm prior to the April and May rains. The expected NO3-N level from the table below for a 160-lb N application is 35 ppm. Laboratory results indicated only 20 ppm NO3-N. The suggested N application rate would be: ((35 ppm – 20 ppm) / 2) x 10 = (15 ppm / 2) x 10 = 7.5 x 10 = 75 pounds per acre.
Example calculation when both NO3-N and NH4-N are determined:
Anhydrous ammonia with nitrapyrin was applied at 160 pounds of N per acre in late April in northern Indiana. Since the N application was relatively recent and a nitrification inhibitor was used , both NO3-N and NH4-N analysis of soil samples were requested. The expected NO3-N plus NH4-N levels listed in the table for a 160-lb N application is 41 ppm. Laboratory results indicated 15 ppm NO3-N and 20 ppm NH4-N for a total measured N level of 35 ppm. The suggested N application rate would be: ((41 ppm – 35 ppm) / 2) x 10 = (6 ppm / 2) x 10 = 3 x 10 = 30 pounds per acre.
Table 1. Expected soil analysis levels of nitrate or nitrate plus ammonium in the upper 1 foot of soil for different rates of applied N fertilizer. NOTE: Use the NO3-N column if this is the only form of N measured in your sample. Add NO3-N and NH4-N levels together if both forms of N are measured in the soil sample and use the last column to assess N availability.
| Fertilizer N Applied Prior to Rains | Nitrogen Analysis | |||
|---|---|---|---|---|
| NO3-N | NO3-N + NH4-N | |||
| lbs/acre | ppm or mg/L N | |||
| 130 | 30 | 36 | ||
| 140 | 31 | 37 | ||
| 150 | 33 | 39 | ||
| 160 | 35 | 41 | ||
| 170 | 36 | 42 | ||
| 180 | 38 | 44 | ||
| 190 | 40 | 46 | ||
| 200 | 41 | 47 | ||
| 210 | 43 | 49 | ||
| 220 | 45 | 51 | ||
| * | ** | |||
A number of application methods are available for N application in tall corn; including urea broadcast with airplane, helicopter or high-clearance box spreader and liquid N dribbled on the soil surface or injected into the soil with high-clearance applicators. Surface-applied urea or liquid N (50% urea) can lose some ammonia to the air but the canopy and banding (for liquid N) reduce the magnitude of potential loss. In either case N loss is likely less than 10% of the urea applied.
All the N sources will "burn" tissue that they contact or dissolve on, but generally the damage is considered cosmetic. And the various methods will cause different levels of collateral damage on end rows and during the application process. Although these methods of application are clearly different there are no clear best or worst options. If the crop needs nitrogen and more than one of these methods is available consider the cost, the amount of N that can be applied versus the amount of N that is needed, and the ancillary effects of the application process.
If no fertilizer N has been applied this season or soil N measurements suggest little N remains from fall- and spring-applied N, consider using our current N rate guidelines based on results of field trials conducted since 2006 throughout the state using efficient methods and timings of N fertilizer application. This information is summarized at: http://www.kingcorn.org/news/timeless/NitrogenMgmt.pdf
The average Agronomic Optimum N Rate (AONR) for 38 trials conducted on medium- and fine-textured soils in westcentral and southwest Indiana was 183 lbs N / ac. The average AONR for 26 trials conducted on medium- and fine-textured soils in northwest and northcentral Indiana was 191 lbs N / ac. The average AONR for trials conducted on medium- and fine-textured soils in other regions of the state were 196, 221, 226, and 233 lbs N / ac for southeast (11 trials), central (23 trials), northeast (10 trials), and eastcentral (25 trials) Indiana, respectively. The average AONR for 14 trials on non-irrigated sandy soils was 184 lbs N / ac.
At the five Purdue locations where we conducted paired trials of corn/soy and corn following corn (corn/corn) in 2007-2010, the average AONR for corn/corn was 44 lbs greater than for corn/soy while average corn/corn yields were 18 bu/ac less than the corn/soy yields. Economic optimum N rates for various combinations of N cost and grain price can be obtained from the web site noted above.
Loss of N due to excessive rainfall and the potential response of corn stressed by N deficiency AND excess water are difficult to predict. Unfortunately we frequently find ourselves in this same situation asking how much N is needed and what will be the yield increase. Although we have conducted some planned experiments that apply N late to N-deficient corn, it is difficult to plan experiments to evaluate N application to N-deficient corn that is also stressed by excessive rainfall. But now we have another opportunity.
If you decide to apply late N to corn stressed by N deficiency AND waterlogging, consider leaving 3 non-fertilized applicator-wide strips down the length of the field to help evaluate the response to the additional N. The non-fertilized strips should be distributed across the field, not lumped together. Compare the eventual grain yield from these unfertilized strips with that of adjacent fertilized strips to determine the change in yield and profit due to fertilization. Collecting this data will help in making future decisions related to N loss and potential profit from supplemental N fertilization. For assistance in planning an evaluation of supplemental N consult one of us or adapt our Purdue On-Farm Nitrogen Rate Trial Protocol, available online at:
http://www.agry.purdue.edu/ext/ofr/protocols/PurdueNTrialProtocol.pdf.
Blackmer, A.M., D. Pottker, M.E. Cerrato, and J. Webb. 1989. Correlations between soil nitrate concentrations in late spring and corn yields in Iowa. J. Prod. Agric. 2:103-109.
Brouder, Sylvie and David Mengel. 2003. The Presidedress Soil Nitrate Test for Improving N Management in Corn (AY-314-W). Purdue Extension. Online at http://www.agry.purdue.edu/ext/pubs/AY-314-W.pdf. [URL accessed June 2015].
Camberato, Jim. 2014. Late-season nitrogen application for corn. Soil Fertility Update, Purdue Univ. Agronomy. Online at http://www.agry.purdue.edu/ext/soilfertility/news/Late-seasonnitrogen.pdf. [URL accessed June 2015].
Camberato, Jim & RL (Bob) Nielsen. 2015. Nitrogen Management Guidelines for Corn in Indiana. Applied Crop Research Update, Purdue Univ. Agronomy. Online at http://www.kingcorn.org/news/timeless/NitrogenMgmt.pdf [URL accessed June 2015].
Certified Soil Testing Laboratories. 2010. Purdue Agronomy Extension [On-line]. Online at https://ag.purdue.edu/agry/extension/Pages/soil_testing.aspx. [URL accessed June 2015].
Ferrer, Francesc, J.M. Villar, C.O. Stockle, P. Villar, and M. Aran. 2003. Use of a pre-sidedress soil nitrate test (PSNT) to determine nitrogen fertilizer requirements for irrigated corn. Agronomie 23:561-570.
Mengel, David. 1995. Roots, Growth, and Nutrient Uptake. Purdue Agronomy Extension Paper AGRY-95-08. [On-line]. Online at http://www.agry.purdue.edu/ext/pubs/AGRY-95-08.pdf. [URL accessed June 2015].
Miller, Eric, RL (Bob) Nielsen, and Jim Camberato. 2011. Response of Corn to Late-season Nitrogen Application. Corny News Network, Purdue Univ. Extension. Online at http://www.kingcorn.org/news/timeless/CornRespLateSeasonN.html. [URL accessed June 2015].
Areas of light green to yellow, often stunted, corn plants are visible in many corn fields throughout the state at this point in mid-June. There is no single cause for such crappy™ looking corn (Nielsen, 2012) and multiple causes may occur in the same field, which makes for challenging diagnoses and frustrating discussions with the grower. I offer a few observations from my recent travels around the state about some of the common causes of ugly stands of corn this year.
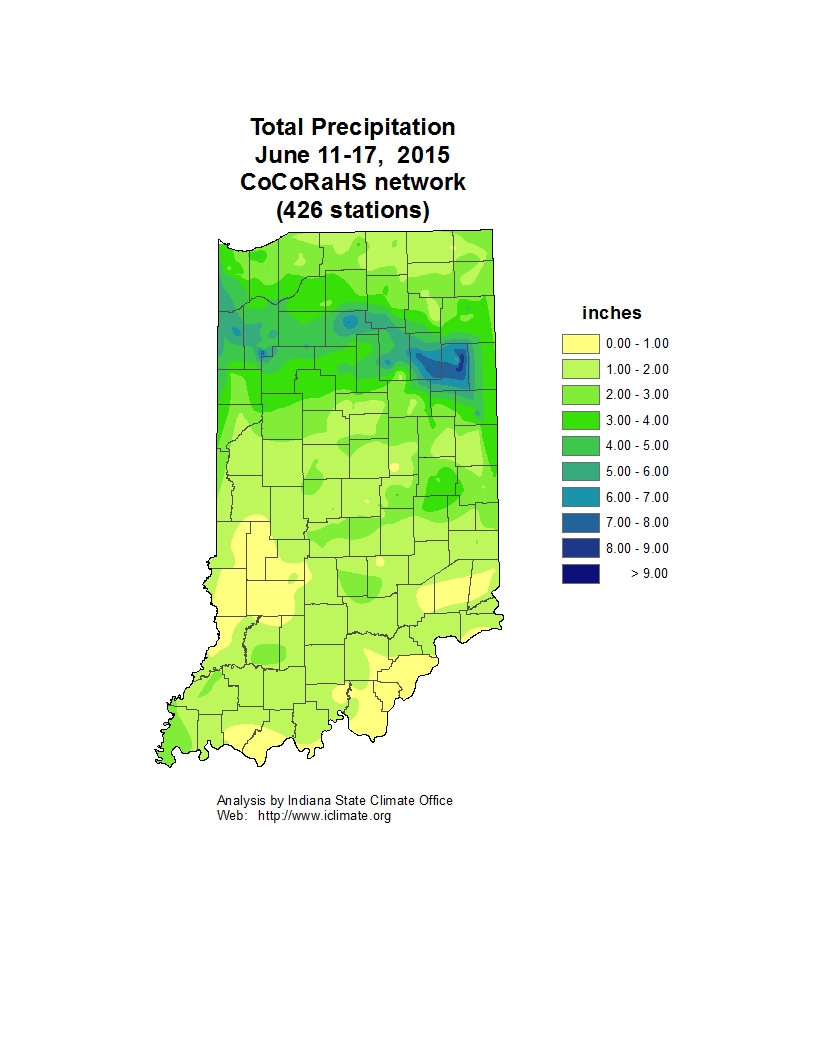
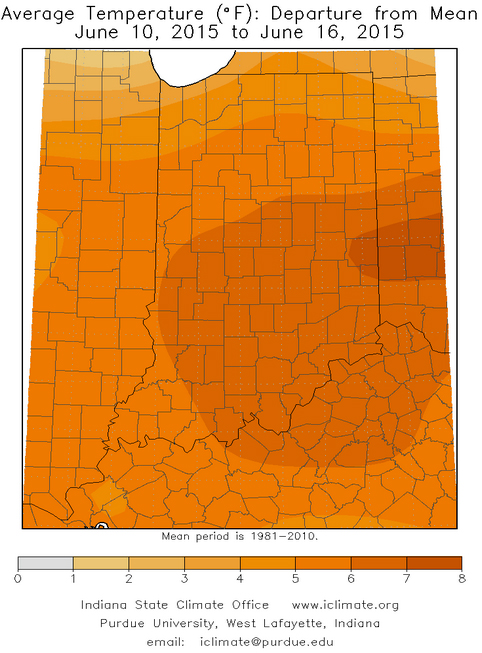
Frequent and, often, excessive rainfall is one of the more common underlying themes this year, especially in the northern third or half of Indiana. As of 13 June, the accumulated precipitation for the past 30 days has been 25 to 50% above average in those areas of the state (Midwestern Regional Climate Center, 2015). More importantly, rainfall amounts during the past 7 days have ranged, statewide, from 75% to 300% above average northwest of a line extending roughly from Vincennes (southwest IN) to Richmond (eastcentral IN). Localized rainfall amounts have been even greater in some areas. Such excessive rainfall results in ponding or flooding of fields and lengthy periods of saturated soils after the water recedes or drains away. Root damage occurs rapidly in oxygen-depleted soils, especially with warm temperatures, resulting in plant death or stunting.
The consequences of excessive rainfall are accentuated in soils that are naturally poorly drained, especially if the fields are not well drained by artificial drainage tile or surface drains. Field to field variability for the adequacy of the artificial drainage often results in "black and white" differences in adjacent fields of corn that receive the same amount of excessive rainfall over a period of days or weeks. Even in fields with generally adequate artificial drainage, there will be small areas that are not well-drained and root health of young corn plants will suffer due to lengthy periods of saturated soil conditions. Some of the signs of such poorly drained areas include algae growth on the soil surface and damp-loving nutsedge plants.
The existence of compacted soil layers accentuates the consequences of excessive rainfall on poorly drained fields. Beginning way back last fall during harvest, opportunities for creating soil compaction have been abundant throughout the state from all sorts of field activities... harvest machinery (combines, grain carts), tillage equipment (fall and spring), fertilizer spreaders (fall and spring), manure spreaders (fall and spring), planters (sidewall compaction). Soil compaction further decreases natural soil drainage and lengthens the time period in which soils remain saturated (anerobic) and detrimental to root health.
Even in the absence of excessive rainfall, soil compaction has negative effects on the initial stand establishment of a corn crop. Planter sidewall compaction restricts the seedlings' root development to the furrow itself for long periods of time. Soil compaction caused by tillage tools further limit the natural downward development of the crop's root system. Together, the net result is a shallow-rooted crop that is especially vulnerable to the effects of inadequate rainfall, as has been the case in some areas of southern Indiana since planting.
Some areas within fields are lighter green than other areas simply due to differences in soil color. In years when temperatures after planting are relatively cool, lighter colored soils (lower soil organic matter) warm slightly slower than darker colored soils. Slightly cooler soil temperatures translate into slightly fewer Growing Degree Days (GDDs). Slightly fewer GDDs per day over enough days easily translate to a leaf stage or two less development than in the darker, warmer soils (Nielsen, 2014). In reality, the lighter green areas are simply areas where plant development is behind that of other areas. When you are walking a field near the time it is transitioning to the rapid growth phase (sometime after leaf stage V6), minor differences in leaf stage development throughout a field can be visually dramatic. The more developed areas of the field will be taller and darker green than areas of the field that are 1 or 2 leaf stages behind. Yet, plant health may in fact be identical in both areas even though your eyes tell you something is "wrong" with the areas of lighter green plants.
Cool and wet stand establishment periods for corn can be conducive for the development of and damage by parasitic corn nematodes (Faghihi & Ferris, 2015). Certainly, the 2015 growing season has been characterized as cool and wet during stand establishment in many areas of the state. We tend to think about corn nematodes being primarily restricted to sandier soils, but that is not always the case. There is no question that some of the fields in 2015 exhibiting yellow and stunted corn plants may be due to damage caused by parasitic corn nematodes. If you suspect corn nematodes are the culprit, send soil samples in to the Nematology Lab at Purdue (Faghihi & Ferris, 2015).
Cool and wet stand establishment periods for corn can also be conducive for the eventual development of seedling blights (Sweets, 2015). Most of the disease-causing fungi are controlled effectively by the fungicidal seed treatments commonly used by the seed industry. The problem is that the seed treatments do not last forever. Slowly developing corn seedlings, in response to a cool stand establishment period, may fail to transition sucessfully to reliance on their nodal root systems before the seed treatments deteriorate and disease develops on the mesocotyl or seed. Symptoms often develop three or more weeks after planting when seedling development has been slow.
More and more growers apply the bulk of a corn crop's nitrogen fertilizer after emergence of the crop, which certainly minimizes the risk of losing soil fertilizer N before crop uptake occurs. However, some fail to combine the benefits of a sidedress N application program with a robust starter fertilizer program during planting. The combination of soil N loss and stunted corn root development that occur in an excessively wet early season almost always results in a crop prior to sidedressing that is yellow and stunted. The severity of the problem is even greater where a) sidedressing is delayed because of frequent rains and/or b) corn follows corn where there is additional immobilization of soil N by the decomposing corn residues from the previous year.
Faghihi, Jamal and Virginia Ferris. 2015. Nematode Update: Corn Parasitic Nematode. Pest & Crop Newsletter, Purdue Extension. http://extension.entm.purdue.edu/pestcrop/2015/Issue8/ [URL accessed June 2015].
Midwestern Regional Climate Center. 2015. Midwest Climate Watch. http://mcc.sws.uiuc.edu/cliwatch/watch.htm#curMonths [URL accessed June 2015].
Nielsen, RL (Bob). 2012. A Recipe for Crappy Stands of Corn. Corny News Network, Purdue Extension. http://www.kingcorn.org/news/timeless/CrappyStands.html [URL accessed June 2015].
Nielsen, RL (Bob). 2014. Use Thermal Time to Predict Leaf Stage Development in Corn. Corny News Network, Purdue Extension. http://www.kingcorn.org/news/timeless/VStagePrediction.html [URL accessed June 2015].
Nielsen, RL (Bob). 2015. Effects of Flooding or Ponding on Corn Prior to Tasseling. Corny News Network, Purdue Extension. http://www.kingcorn.org/news/timeless/PondingYoungCorn.html [URL accessed June 2015].
Sweets, Laura. 2015. Seed Decay and Seedling Blights of Corn. Integrated Pest & Crop Management, Univ of Missouri. http://ipm.missouri.edu/IPCM/2015/6/Seed-Decay-and-Seedling-Blights-of-Corn [URL accessed June 2015].
Purdue Cooperative Extension Service
Purdue Extension Entomology
901 W. State Street
West Lafayette, IN, 47907
(765) 494-8761
luck@purdue.edu
@PurdueExtEnt
PurdueEntomology
![]()
If you would like to be alerted by e-mail when the current issue of the Pest&Crop is available on-line, please enter your e-mail address and click the submit button.
It is the policy of the Purdue University Cooperative Extension Service that all persons have equal opportunity and access to its educational programs, services, activities, and facilities without regard to race, religion, color, sex, age, national origin or ancestry, marital status, parental status, sexual orientation, disability or status as a veteran. Purdue University is an Affirmative Action institution. This material may be available in alternative formats.