
USDA-NIFA Extension IPM Grant
Pest & Crop Newsletter, Entomology Extension, Purdue University
Black Cutworm Moth Catches Increasing - (Christian Krupke and John Obermeyer)
• Arriving moths are looking for egg laying sites (e.g., weedy fields, fields with extensive ground cover, etc.), and there are many out there.
• Accumulations of approximately 300 heat units (base 50°F) needed after egg hatch before crop damage will be noted.
• Follow-up scouting is imperative.
Black cutworm moth catches in pheromone traps, throughout the state, have been a mixed bag over the last few weeks (see “Black Cutworm Adult Pheromone Trap Report”). However, with the recent fronts and warmer temperatures, trap catches increased in several areas over the past week. Although the numbers are not alarmingly high (unlike the last 2 years), it does signal that we may see some feeding activity this growing season. This will be especially true if producers’ fields received anticipated rain showers and weed control activities are delayed, and if moth flights into the state continue.
Refer to the following map, where we are tracking black cutworm development from the time of an intensive capture to when we expect first cutting/damage. Based on the growth development model, it takes approximately 300 heat units (50?F base) from egg hatch to early 4th instar; this is the life stage when black cutworm larvae begin to cut plants. Some leaf injury may be present before then. Using pheromone trapping of moths and tracking of heat unit accumulations for first cutting is not an exact science, but they do give us a good indication of what to expect. It is not possible to predict if individual fields will be infested. Remember, based on past history, most fields in the state will see little or no activity. This is just not a pest that has done much damage statewide lately, although just a few fields are hit hard each year.
Cutworms can be managed very effectively through timely field monitoring to determine if and when an insecticide is needed. Chances are, an insecticide will not be needed. In addition, insecticides can be applied to protect against potential cutworm problems. These “insurance” treatments are seldom cost-effective, however, because cutworms are a very sporadic problem and most fields treated would not suffer any economic damage even if left untreated. Furthermore, these preventative treatments may not provide acceptable control of heavy infestations of cutworms, necessitating a rescue treatment. Happy Scouting!
![]()
Slugs Reported in Cover Crops Before Planting - (Christian Krupke and John Obermeyer)
• Slug damage is exacerbated in a cool, wet spring with heavy crop residue on the soil surface.
• Crop damage and stand losses are most severe when slugs enter open seed slots.
• Control options are limited and need to be applied early.
Slugs are soft-bodied, legless, slimy, and whitish to black gastropods. Their length, depending on species, is usually 1/2 to 1-1/2 inches long. Build-up of slug populations is greatest in high-residue, undisturbed soils with plant cover, because the optimum conditions for slug survival (wet soils) are most likely to occur under these conditions. Juvenile slugs, which are present now, will continue to increase in size, as will their appetite. Depending on future weather, their feeding can continue well into June.
Cover crops can provide the perfect environment for slugs to establish, potentially allowing for no-tilled corn and soybean seedlings to be significantly damaged by this nocturnal pest. Their mouthparts cause a scraping type of damage, where the top layer of leaf tissue is removed. On corn, slugs feed on the surface tissue of leaves resulting in narrow, irregular, linear tracks or scars of various lengths. Severe feeding can result in split or tattered leaves that resembles hail damage. Soybean damage is not as predominant on the foliage, but rather on the hypocotyl and cotyledons. Given good growing conditions, plants usually outgrow slug damage once the crop is up. Most damage and stand losses by slugs occur when fields are too wet to plant and seed slots are not properly closed. In this situation, slugs can be found feeding on the seedlings within the slot, day or night. Obviously, once the growing point of corn or soybeans is injured, plant recovery is unlikely.
Control of slugs is difficult, if not impossible, typically because damage to crops is found too late. However, if scouting high-risk fields indicates slugs are active, there are a couple pre-plant options to consider. Disruption of their environment, i.e., tillage, can be highly effective, but is typically not an viable option, especially on long-term no-till or highly erodible land. Chemical control options are limited and a bit expensive. Dr. Ron Hammond, Ohio State University entomologist - and the man who knows more about slugs in field crops than anyone on earth - addresses the products and their efficacy in their most recent, and very informative, C.O.R.N. newsletter (2013-12, May 7) <http://corn.osu.edu/c.o.r.n.-newsletter#2>. Read it!
Where replanting is necessary from slug damage, one should strongly consider lightly tilling the area first. This should help dry the area and break-up and bury crop residue. Doing so will discourage further slug activity. Granular, liquid, and seed-applied insecticides are ineffective against slugs, as they slime over them. Bt corn has no effect on slugs. Home remedies, such as spraying plants at night with liquid fertilizer (high salt concentration), have proved futile and are obviously impractical for large-scale plantings.
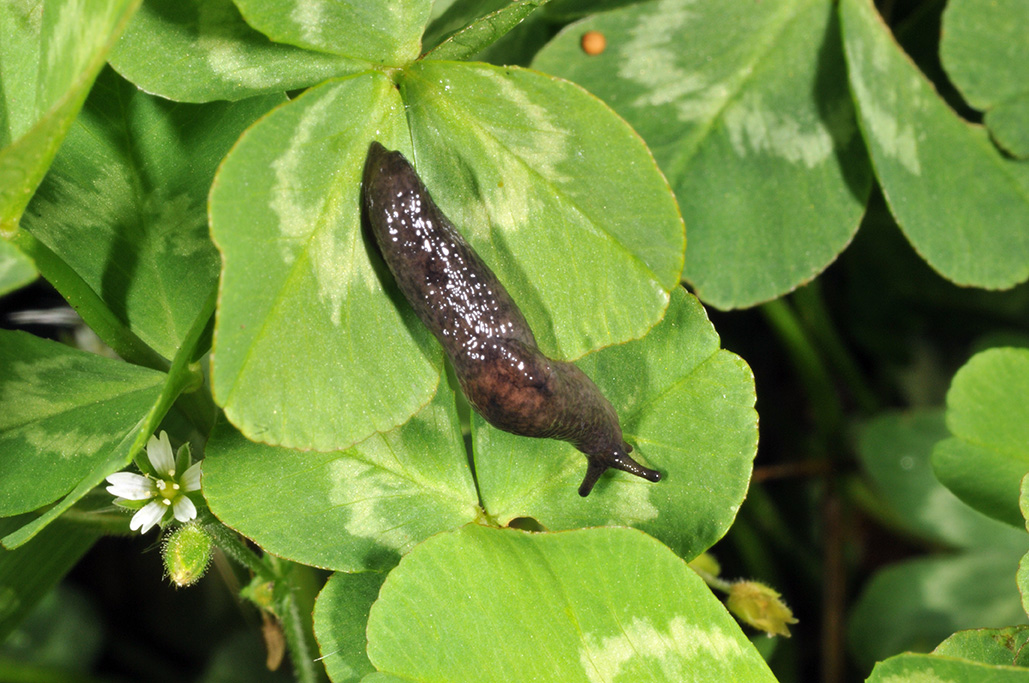
Black slug on clover leaves
![]()
Click here to see the Black Cutworm Adult Pheromone Trap Report
![]()
Click here to see the Black Light Trap Catch Report
![]()
Time to Monitor Risk of Fusarium Head Blight (Scab) in Wheat – (Kiersten Wise)
•Monitor the wheat scab risk map during head
emergence and flowering: <http://www.wheatscab.psu.edu/>.
•Sign up for updates on risk of scab at
<http://scabusa.org/fhb_alert.php>.
Wheat will be flowering (Feekes 10.5.1) in far southern Indiana soon, and is in early boot (Feekes 10) in central Indiana. Wheat in northern Indiana is further behind, and in some areas is just now at or just past jointing (Feekes 6-7). As wheat approaches flowering (Feekes 10.5.1, Figure 1) it is important to consider the risk for Fusarium head blight, or scab, development.
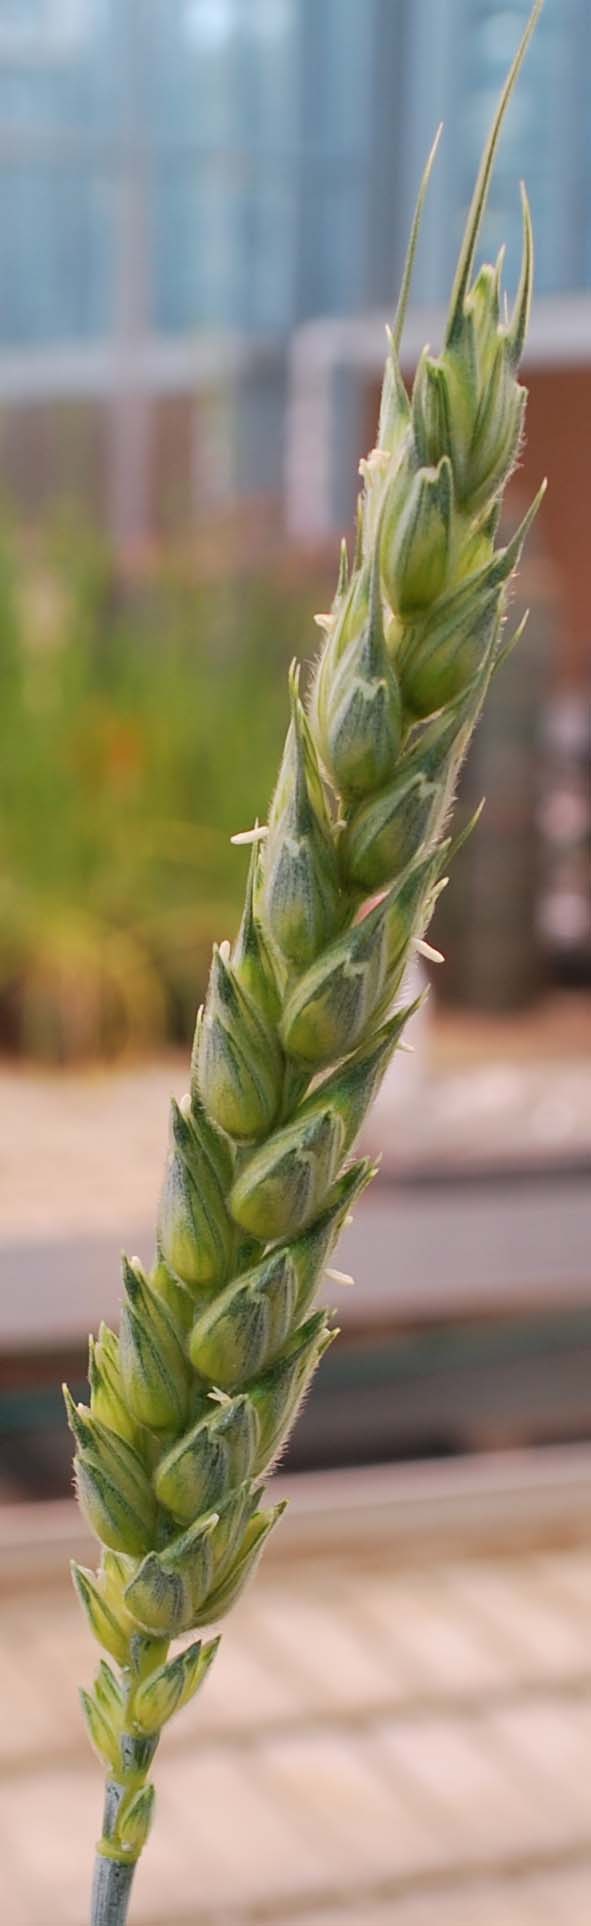
Figure 1. Feekes 10.5.1 or beginning flowering of the wheat plant
The fungus that causes head scab, Fusarium graminearium, infects wheat during flowering, beginning at Feekes 10.5.1. Symptoms include bleached spikelets on the head (Figure 2), and small or shriveled grain kernels, commonly called “tombstones”. The fungus also produces mycotoxins, such as deoxynivalenol, or DON, which can accumulate in the infected grain.
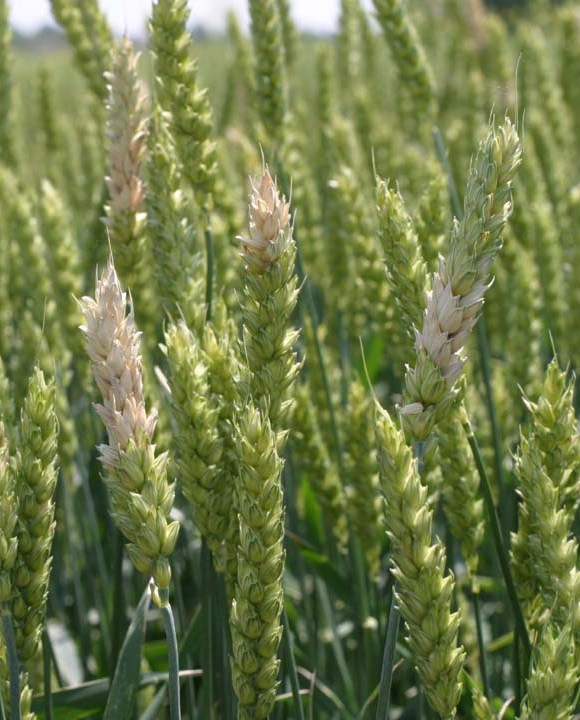
Figure 2. Bleached spikelets symptomatic of Fusarium head blight
Rainy, warm, and humid weather conditions favor disease development. We have had ample moisture this spring, but temperatures have also remained cool, lowering risk for disease development. If temperatures increase, and moisture and humidity persist as wheat begins to flower, it is possible that a fungicide application will be necessary to suppress Fusarium head blight.
Now is a good time to become familiar with the risk assessment tool available to assess the risk of Fusarium head blight in Indiana. This model can be accessed through the following link: <http://www.wheatscab.psu.edu/>.
At this site there are several links that explain how the model was developed, and links providing additional information about Fusarium head blight on wheat. To access the model, click on the box marked “Fusarium Risk Assessment Tool.” Next, select Indiana from the drop-down menu of states. Commentary on Indiana wheat development and disease risk will be displayed on this screen, as well as Indiana weather stations. Clicking on a weather station within the state will generate a prediction for the risk of Fusarium head blight development in that area (Figure 3). Predictions can be forecasted for up to 72 hours from the assessment date.
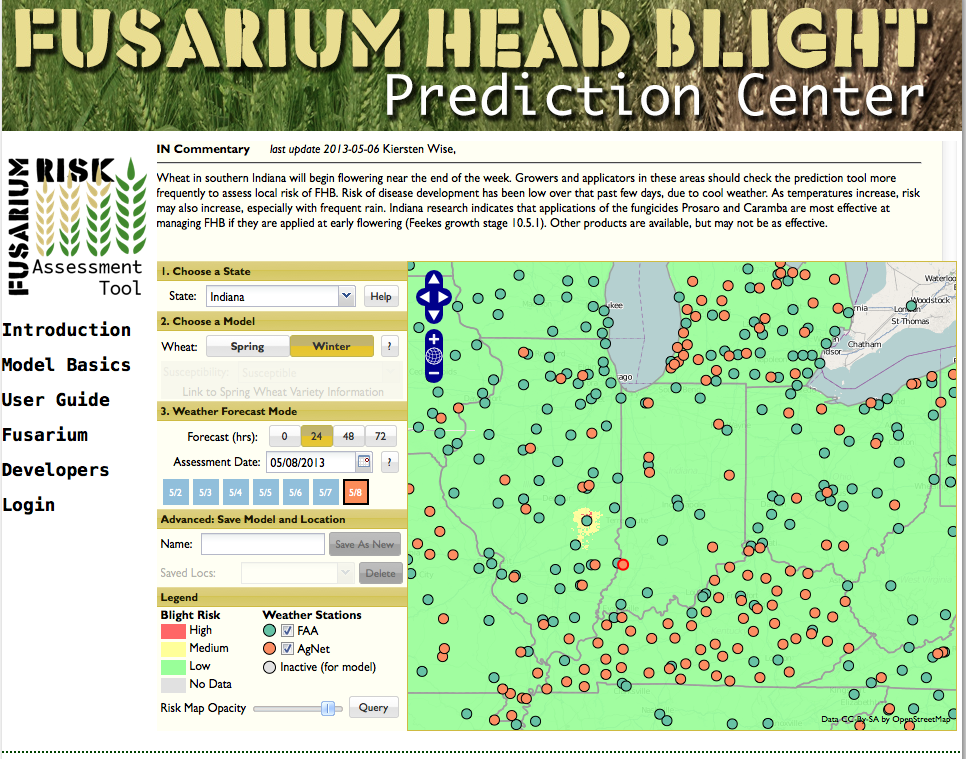
Figure 3. Indiana commentary and risk of Fusarium head blight development on the wheat scab risk model: <http://www.wheatscab.psu.edu/>
This model uses weather information including temperature, rainfall, and relative humidity to calculate risk levels for Fusarium head blight. Although it is a good tool for predicting risk, it has an estimated accuracy level of 80%. For example, the map currently indicates an overall low risk throughout Indiana, but localized areas in southern Indiana may be at moderate risk, based on recent rainfall and temperatures. Keep in mind that the model does not provide a guaranteed prediction for whether or not scab will occur in individual fields, and additional factors such as the local weather forecast, crop conditions, and Extension commentary should be considered when assessing the level of risk. Producers can sign up for alerts courtesy of the U.S. Wheat and Barley Scab Initiative. Alerts can be sent to a cell phone or email, and will be sent out as the risk map updates risk of scab in Indiana. To sign up for alerts, visit: <http://scabusa.org/fhb_alert.php>.
Crop rotation and selection of partially resistant varieties can help reduce the impact of Fusarium head blight development, but timely fungicide applications may be needed to suppress the disease in-season. There are several fungicides available for Fusarium head blight control, and these are listed in the foliar fungicide efficacy table developed by the North Central Regional Committee on Management of Small Grain Diseases or NCERA-184 committee, and through the Purdue Extension bulletin BP-162-W: <https://ag.purdue.edu/btny/Extension/Pages/ExtPubs.aspx>.
The fungicides Caramba and Prosaro were given a rating of “good” based on a designation system from the Regional Wheat Disease Committee. Products containing only tebuconazole (Folicur, others) were rated as fair, and propiconazole alone (Tilt, others) was rated as poor for management of Fusarium head blight. Fungicides that have a strobilurin mode of action are not labeled for Fusarium head blight suppression. Be sure to follow label restrictions on how many days must pass between fungicide application and harvest.
The foliar disease Septoria/Stagonospora leaf blotch has been observed in fields throughout the state, but is still at relatively low levels in most of Indiana due to cool weather. Symptoms of this disease are now visible on the leaves just below the flag leaf in areas in southern Indiana. Fungicides applied at flowering for FHB suppression will also provide some level of protection from foliar disease on the flag leaf. Producers in northern IN who are considering a foliar fungicide application for Septoria/Stagonospora leaf blotch control through boot stage should keep in mind that applications made prior to flowering will NOT suppress FHB or the associated mycotoxin deoxynivalenol, or DON. If the risk for FHB increases after foliar fungicide applications are made, it may be necessary to make another application at flowering for FHB suppression.
![]()
The Pace of Corn Planting Progress Over Years: Another Conundrum – (Bob Nielsen) -
In response to this year's delayed planting season, I recently discussed the conundrum of statewide corn yields relative to statewide planting progress (Nielsen, 2013). There is another conundrum related to the fact that today’s larger field equipment, including planters, allows for greater planting progress per day or per week than was possible many years ago. This fact encourages optimism that delayed starts to the planting season can be overcome by the ability to plant a greater percent of the state’s crop per week when “push comes to shove.”
Certainly, the number of 24-, 32-, 36-row, or larger planters across the U.S. Midwest is greater today than, say, twenty years ago. Certainly, an individual farmer can plant more acres of corn per day with this large equipment than 20 years ago. However, historical data suggests that the pace of corn planting in terms of percent of total corn acres planted each week has not changed in 20 years.
Figure 1 depicts the single greatest week of corn planting progress in Indiana for each year since 1992. The record greatest weekly planting pace during those 21 years was 50 percent during the first week of May in 2001. The next two fastest weeks of corn planting progress were in 1992 and 1993 with 46 and 42 percent, respectively. Indiana corn growers have rarely come close to that magnitude of weekly planting progress since.
So, the conundrum is why has the maximum percent of total corn acres planted in single week not increased in 20 years? The answer does not appear to be related to changes in total corn acres planted in Indiana because that number has remained fairly consistent in recent history (Fig. 1).
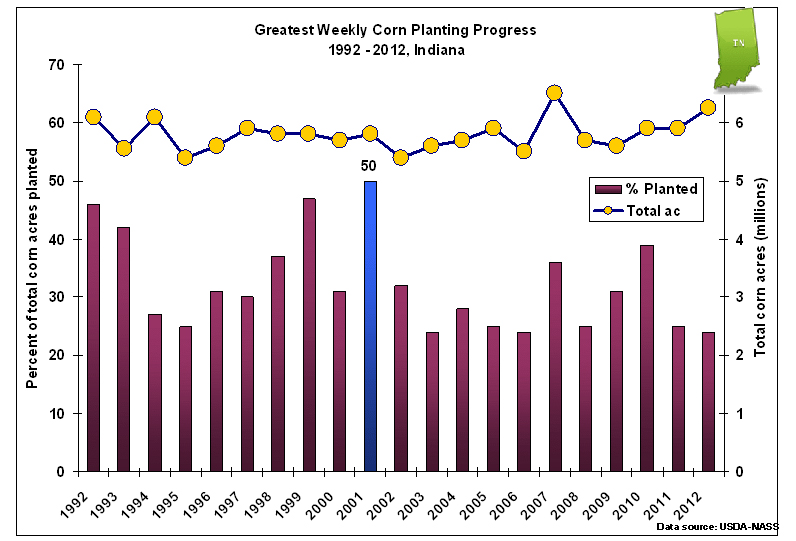
Fig. 1. The greatest single week of corn planting progress (percent of corn acres planted) in Indiana each year since 1992.
One could speculate that farmers today are planting soybeans earlier than they did twenty years ago and so fewer resources are available to plant corn during the traditionally important 4-week planting window that begins in late April. One way to address this question is to calculate the ratio of soy to corn planting progress during that 4-week period and then determine whether that ratio has changed over time. Doing so indeed suggests that soybean planting progress during that 4-week period has increased somewhat since 1992, but the historical relationship is statistically very weak (Fig. 2).
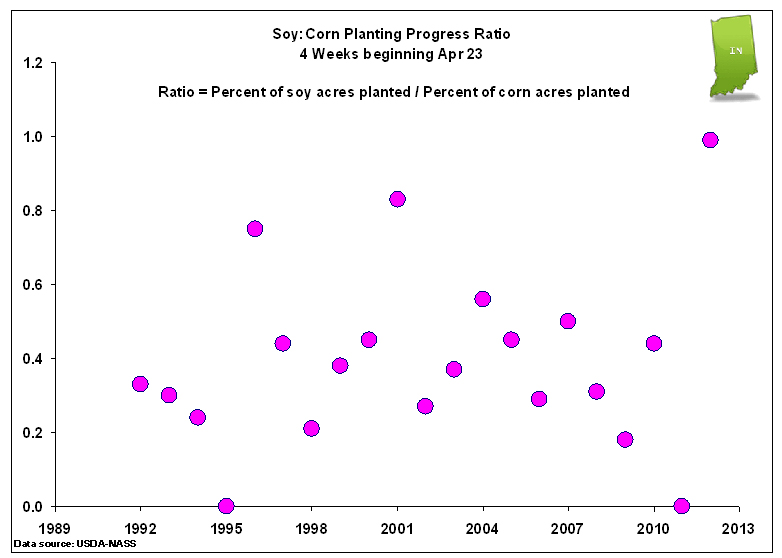
Fig. 2. The annual ratio of (Percent of soy acres planted) versus (Percent of corn acres planted) during the 4-week period beginning April 23. Indiana soybean and corn planting progress, 1992-2012.
Another factor that may contribute to the planting pace conundrum is the fact that the number of corn growers in Indiana has decreased over time and those remaining are farming more acres than they did twenty years ago. Even though farm machinery is larger today and cover more acres per day than twenty years ago, fewer farmers are farming more acres and so total planting progress in terms of percent of total acres per week remains fairly unchanged.
For what it’s worth, that’s my opinion and you are entitled to it.
Related Reading
Nielsen, RL (Bob). 2013. The Planting Date Conundrum for Corn. Corny News Network, Purdue Univ. online at <http://www.kingcorn.org/news/timeless/PltDateCornYld.html> [URL accessed May 2013].
USDA-NASS. 2013. Quick Stats. USDA Nat’l Ag. Statistics Service. online at <http://www.nass.usda.gov/Quick_Stats> [URL accessed May 2013].
![]()
Weather Outlook by NWS OHRFC – (James Noel, NOAA/NWS/Ohio River Forecast Center) –
The weather pattern supports near normal temperatures over the next 2 weeks along with near normal to slightly above normal rainfall. There will be typical ups and downs as we transition from spring to summer weather. The above normal temperatures of the first full week of May will turn below normal the weekend of May 11-12 into early week of May 13 before going back above normal thereafter. Bottom line, lots of typical spring weather shifts coming up.
It should be noted that there is an increased risk of a frost and minor freeze especially in northern Indiana May 12/13 as a quick cold high pressure moves down from Canada. As we have noted for months, there was an increased risk of late seasons frosts and freezes this spring.

The 8-14 day outlooks along with other outlooks can be found at: <http://www.cpc.ncep.noaa.gov/>.
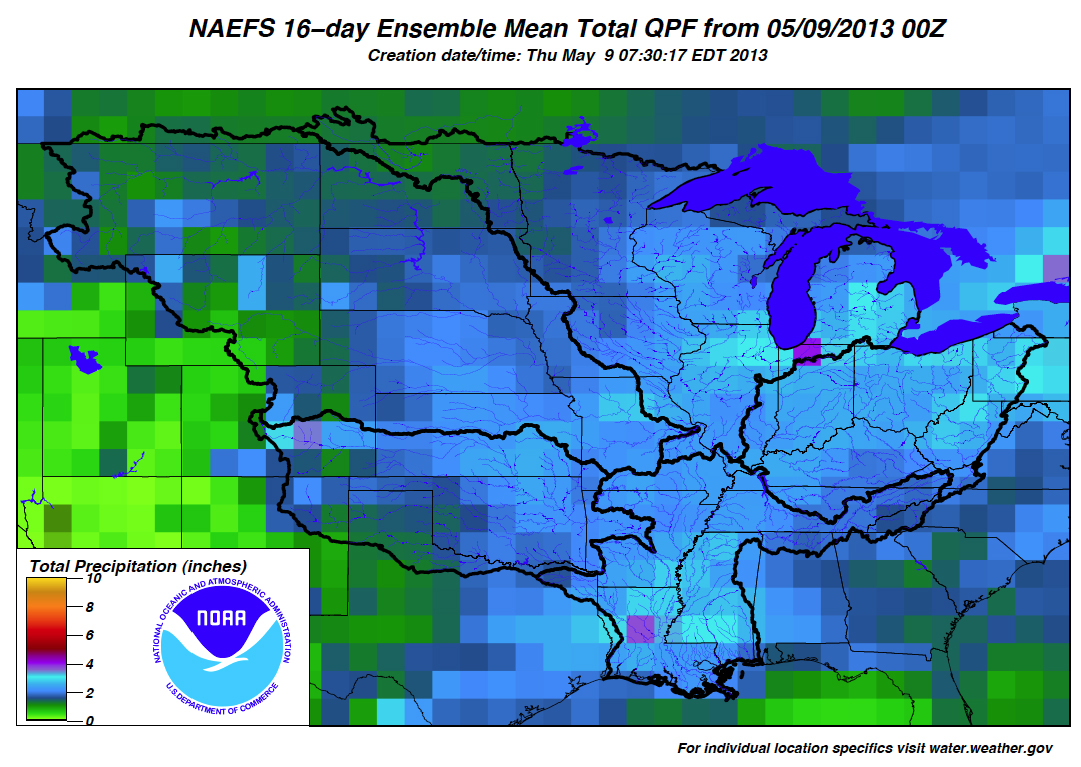
Our two week rainfall outlook calls for 2-3 inches with some higher totals on average. Normal is about 2 inches.
See:<http://www.erh.noaa.gov/ohrfc/HAS/images/NAEFS16day.pdf>, or the following graphic.
Finally, the National Weather Service Ohio River Forecast Center 90-day soil moisture models indicate soil moisture is not expected to deviate that far from normal this summer even though we do still expect a period of warmer and drier weather most likely in late May or June. Current soil moisture is normal to above normal across Indiana.
![]()


![]()