
USDA-NIFA Extension IPM Grant
Pest & Crop Newsletter, Entomology Extension, Purdue University
- Will Insect Pest Pressure Be "Normal" This Year?
- Black Cutworm Adult Pheromone Trap Report
- Black Light Trap Catch Report
Will Insect Pest Pressure Be “Normal” This Year?– (Christian Krupke and John Obermeyer)
•Anticipated pest outbreaks only occasionally materialize.
•Starting insect populations are relatively low.
•There will be surprises in 2013!
Admittedly, this article’s title isn’t as catchy as last year’s fret about bugs becoming worse because of the early start, as we reached May heat units in March! You remember…the season was 2-3 weeks earlier followed by a mild winter, so it was assumed that by summer’s end we would be knee deep in insect poop from our devoured crops. In hindsight, we know that the drought, coupled with heat, reduced most insect populations, with spider mites (not an insect) being the exception. So where is the media coverage this year? Don’t they want to hear about our predictions for a “normal,” or even reduced, insect year? No. They don’t.
Insects can build numbers rapidly after some heavy setbacks. Last year was unkind to many insects. We mentioned in an earlier post that overall the insect world took a “hit” with last year’s drought and heat so they went into winter with fewer numbers. This includes pest, beneficial, and the other insect species. The numbers of our annual-arriving transients into the state, e.g., black cutworm, monitored with pheromone traps haven’t been overly impressive to date.
To steal a cop-out statement from an article last year, “what is predictable about insects is that they can’t be predicted.” So following last year’s drought, a fairly cold winter, and now a wet/cool spring, what would be your projections for this year’s insect population? The story will become clearer once we have some crops in the ground. Happy Scouting!

What may be lurking in this unplanted field?
![]()
Click here to see the Black Cutworm Adult Pheromone Trap Report
![]()
Click here to see the Black Light Trap Catch Report
![]()
Hybrid Maturities for Delayed Planting – (Bob Nielsen) -
Delayed planting seasons create a lot of frustrations for everyone involved with planting crops. One of the agronomic questions that comes up when planting is seriously delayed is whether farmers should consider switching from their normal full-season maturity hybrids to shorter-maturity hybrids. The question is based, of course, on the perceived risk of the crop not reaching physiological maturity before a killing fall freeze and the yield losses that could result. A related, and economic, concern with delayed planting of normal full-maturity hybrids is the risk of high grain moisture contents at harvest and the resulting costs incurred by artificial drying the grain or price discounts by buyers.
Corn development (think growth stage progress) is very dependent on temperature (warm = fast, cool = slow). The accumulation of heat on a daily basis can be quantified on the basis of calculated Growing Degree Days or GDDs. Hybrids can be characterized by how many GDDs they require from planting to physiological maturity (kernel black layer). Conceptually, therefore, one should be able to estimate the GDDs remaining from a delayed planting date to the end of the season using long-term climate data and then choose hybrids with GDD ratings that should mature no later than the date you chose to define “the end of the season”.
FYI: The GDD concept and calculation are described in a related article (Nielsen, 2012a). Interpretation of corn hybrid maturity ratings is also discussed in a related article (Nielsen, 2012b).
One “wrinkle” in this concept is that it appears that hybrids mature in fewer GDDs than expected when planted “late”. Relative to a May 1 planting date, hybrids planted later mature approximately 6.8 fewer GDDs for every day of delay beyond May 1 (Nielsen et al., 2002). For example, a hybrid rated at 2700 GDDs from planting to physiological maturity and planted on May 31 will reach physiological maturity in less than 2500 GDDs after planting (e.g., 2700 - (30 days x 6.8)). That response of hybrid development relative to delayed planting means that normal full-maturity hybrids can be safely planted later than one would think and, consequently, means that growers can avoid switching to earlier maturity hybrids until planting dates later than one would think.
Estimating GDDs Between Two Dates at a Specific Location
The challenge in taking advantage of this relationship between hybrid GDD ratings and delayed planting lies with the estimation of available GDDs with delayed plantings for specific locations. Historical data for daily GDD accumulations exist for a limited number of weather reporting stations around the state, but accessing such data can be difficult. Currently, the Indiana State Climate Office (iClimate.org) does not offer an easy calculator for estimating the number of historical GDDs between two dates at a specific location.
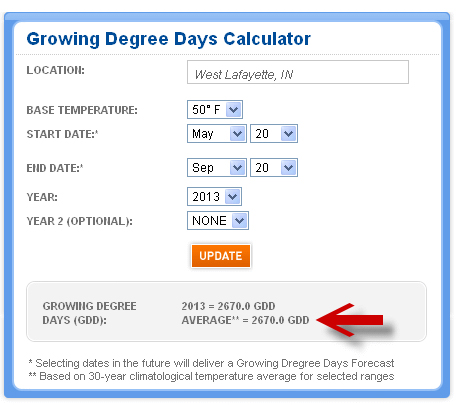
Fig. 1. A screen capture from the online Weather Channel’s GDD Calculator. The red arrow points to the historical average GDD accumulation between May 20 and Sept 20 at West Lafayette, IN.
The Weather Channel™, however, offers such a GDD calculator online at <http://www.weather.com/outdoors/agriculture/growing-degree-days> [URL accessed Apr 2013]. The calculator allows you to enter a city and state, the base temperature for calculating GDDs, start and end dates, and the year. The base temperature for corn should be set to 50°F because that is the threshold temperature used by all seed companies in the U.S.
Figure 1 shows a screen capture from that calculator in which I entered “West Lafayette, IN”, chose “50F” as the base temperature, selected “May 20” as the start date, selected “Sep 20” as the end date, and selected “2013” as the year. After clicking the [UPDATE] button, the calculator estimates that 2670 GDDs would historically accumulate between those two dates at West Lafayette, IN.
TIP: For the purposes of using this calculator for estimating GDDs available to a corn crop for delayed planting, select the current year and use the “AVERAGE” GDD value that displays after you click [UPDATE]. This value represents the historical GDD accumulation based on 30-year climate normals. If you instead select a previous year, the calculator will calculate the ACTUAL GDDs for that previous year.
Choice of “End of Season” Date
The choice of a date to represent the “end of the season” (abbreviated EOS) can be straight-forward or one of those “eyes of the beholder” decisions. If the main concern is to identify a “safe” hybrid maturity that will reach physiological maturity before a typical fall freeze date, then the spatial maps illustrated in the accompanying figures can be used to choose that date. Figure 2 depicts the historical average dates of the first 32°F temperature in the fall throughout Indiana, while Figure 3 depicts the historical average dates of the first 28°F temperature in the fall throughout Indiana.

Fig. 2. Average first fall dates of 32°F temperatures throughout Indiana. Interpolated data derived from spatial analysis of 1981-2010 normal data from Indiana and surrounding states. Brown: 30 Sept to 8-Oct; Yellow: 9-Oct to 16-Oct; Light green: 17-Oct to 25-Oct; Dark green: 26-Oct to 2-Nov; Blue: 3-Nov to 11-Nov. Spatial data source: National Climatic Data Center 1981-2010 US Normals Data.
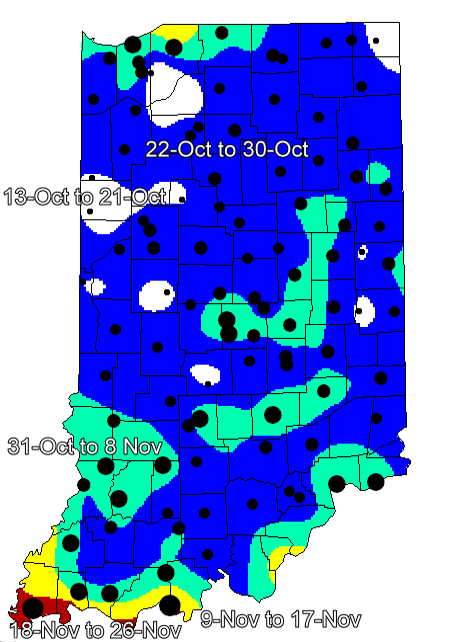
Fig. 3. Average first fall dates of 28°F temperatures throughout Indiana. Interpolated data derived from spatial analysis of 1981-2010 normal data from Indiana and surrounding states. White: 13-Oct to 21-Oct; Blue: 22-Oct to 30-Oct; Green: 31-Oct to 8-Nov; Yellow: 9-Nov to 17-Nov; Red: 18-Nov to 26-Nov. Spatial data source: National Climatic Data Center 1981-2010 US Normals Data.
The Weather Channel™, however, offers such a GDD calculator online at <http://www.weather.com/outdoors/agriculture/growing-degree-days> [URL accessed Apr 2013]. The calculator allows you to enter a city and state, the base temperature for calculating GDDs, start and end dates, and the year. The base temperature for corn should be set to 50°F because that is the threshold temperature used by all seed companies in the U.S.
Figure 1 shows a screen capture from that calculator in which I entered “West Lafayette, IN”, chose “50F” as the base temperature, selected “May 20” as the start date, selected “Sep 20” as the end date, and selected “2013” as the year. After clicking the [UPDATE] button, the calculator estimates that 2670 GDDs would historically accumulate between those two dates at West Lafayette, IN.
TIP: For the purposes of using this calculator for estimating GDDs available to a corn crop for delayed planting, select the current year and use the “AVERAGE” GDD value that displays after you click [UPDATE]. This value represents the historical GDD accumulation based on 30-year climate normals. If you instead select a previous year, the calculator will calculate the ACTUAL GDDs for that previous year.
Choice of “End of Season” Date
The choice of a date to represent the “end of the season” (abbreviated EOS) can be straight-forward or one of those “eyes of the beholder” decisions. If the main concern is to identify a “safe” hybrid maturity that will reach physiological maturity before a typical fall freeze date, then the spatial maps illustrated in the accompanying figures can be used to choose that date. Figure 2 depicts the historical average dates of the first 32°F temperature in the fall throughout Indiana, while Figure 3 depicts the historical average dates of the first 28F temperature in the fall throughout Indiana.
TIP: Temperatures of 32°F or slightly higher typically result in leaf injury or death due to frost damage, but the corn plant technically will survive and be able to at least continue remobilizing stored carbohydrates from the stalk tissues to immature grain. A temperature of 28°F for several hours is considered to be lethal for corn plants.
Some growers may opt to select an “end of season” date earlier than the historical first fall freeze date to ensure that physiological maturity will occur earlier during a time period that may yet be conducive for grain drydown in the field and thus minimize their expenses of drying the grain artificially.
Hybrid Maturity Ratings for Delayed Planting
With an estimate of available growing season GDDs in hand, one can then identify approximate relative hybrid maturities that would be suitable for delayed planting (Tables 1 and 2).
Table 1 can be used to identify “safe” hybrid maturities on the basis of their GDD ratings, though it is important to recognize that the hybrid GDD ratings are for GDDs from planting to physiological maturity. Recognize that some seed companies assign GDD ratings beginning at emergence, not planting. If your seed company is one of these, then add 115 GDDs to the hybrid GDD ratings and you will be in the proverbial “ball park” using this table.
EXAMPLE: Using the Weather Channel’s GDD Calculator, you determine that for Hartford City, Indiana, approximately 2555 GDDs will accumulate between a delayed planting date of May 20 and a selected EOS of Sep 21. Using Table 1, the approximate “safe” hybrid GDD rating that most closely matches 2555 (the 2550 value in column 1) and the May 20 planting date (column 4) is 2679. What this means is that, for the planting date and EOS date you selected, you could safely plant a hybrid with a GDD rating of 2679 from planting to physiological maturity.
| Table 1. Approximate equivalent hybrid GDD requirements for delayed planting relative to estimated actual GDDs available from delayed planting date to the end of the season (EOS). | |||||
| Plant Date | 1-May | 10-May | 20-May | 30-May | 10-Jun |
| Available GD From Planting to EOS | Appro. Equivalent Hybrid GDD; Adjusted for Delayed Planting | ||||
| 2000 | 2000 | 2061 | 2129 | 2197 | 2272 |
| 2050 | 2050 | 2111 | 2179 | 2247 | 2322 |
| 2100 | 2100 | 2161 | 2229 | 2297 | 2372 |
| 2150 | 2150 | 2211 | 2279 | 2347 | 2422 |
| 2200 | 2200 | 2261 | 2329 | 2397 | 2472 |
| 2250 | 2250 | 2311 | 2379 | 2447 | 2522 |
| 2300 | 2300 | 2361 | 2429 | 2497 | 2572 |
| 2350 | 2350 | 2411 | 2479 | 2547 | 2622 |
| 2400 | 2400 | 2461 | 2529 | 2597 | 2672 |
| 2450 | 2450 | 2511 | 2579 | 2647 | 2722 |
| 2500 | 2500 | 2561 | 2629 | 2697 | 2772 |
| 2550 | 2550 | 2611 | 2679 | 2747 | 2822 |
| 2600 | 2600 | 2661 | 2729 | 2797 | 2872 |
| 2650 | 2650 | 2711 | 2779 | 2847 | 2922 |
| 2700 | 2700 | 2761 | 2829 | 2897 | 2972 |
| 2750 | 2750 | 2811 | 2879 | 2947 | 3022 |
| 2800 | 2800 | 2861 | 2929 | 2997 | 3072 |
| End of Season (EOS) defined by user, but may be based on expected first fall 32°F temperature. Equivalent hybrid GDDs = Available GDDs adjusted for hybrid GDD response to planting delays beyond May 1 (Nielsen, et.al., 2002). | |||||
| Table 2. Approximate maximun “safe” hybrid CMR for delayed planting relative to estimated actual GDDs available from delayed planting date to the end of the season (EOS). | |||||
| Plant Date | 1-May | 10-May | 20-May | 30-May | 10-Jun |
| Available GDD From Planting to EOS | Approx. Hybrid CRM Based on Plant Date & Approx. Available GDDs | ||||
| 2000 | 82 | 85 | 88 | 91 | 94 |
| 2050 | 84 | 87 | 90 | 93 | 96 |
| 2100 | 87 | 89 | 92 | 95 | 98 |
| 2150 | 89 | 91 | 94 | 97 | 101 |
| 2200 | 91 | 94 | 97 | 100 | 103 |
| 2250 | 93 | 96 | 99 | 102 | 105 |
| 2300 | 95 | 98 | 101 | 104 | 107 |
| 2350 | 97 | 100 | 103 | 106 | 109 |
| 2400 | 100 | 102 | 105 | 108 | 111 |
| 2450 | 102 | 104 | 107 | 110 | 114 |
| 2500 | 104 | 107 | 110 | 113 | 116 |
| 2550 | 106 | 109 | 112 | 115 | 118 |
| 2600 | 108 | 111 | 114 | 117 | 120 |
| 2650 | 111 | 113 | 116 | 119 | 122 |
| 2700 | 113 | 115 | 118 | 121 | 125 |
| 2750 | 115 | 118 | 120 | 123 | 127 |
| 2800 | 117 | 120 | 123 | 126 | 129 |
| End of Season (EOS) defined by user, but may be based on expected first fall 32°F temperature. Hybrid CRMs as defined by DuPont Pioneer and calculated on the basis of the relationship between GDDs from planting to physiological maturity and hybrid CRMs of 73 hybrids listed in DuPont Pioneer’s 2012 hybrid characteristics table. | |||||
Some folks are more comfortable with the relative “days to maturity” ratings for corn hybrids (Nielsen, 2012b). Table 2 expresses the GDD values of Table 1 in terms of CRM ratings as defined by DuPont Pioneer. Recognize that I am not by any stretch of your imagination promoting Pioneer hybrids. I simply know that Pioneer assigns GDD ratings to their hybrids based on GDD accumulations between planting and physiological maturity. The mathematical relationship between their GDD ratings and their CRM ratings is pretty good and, thus, can be used to calculate approximate CRM ratings from known GDD ratings. If you are not comfortable using Pioneer’s CRM ratings, then use the GDD ratings in Table 1.
EXAMPLE: If you continue on to Table 2, the approximate “safe” hybrid Pioneer CRM rating that most closely matches 2555 (the 2550 value in column 1) and the May 20 planting date (column 4) is 112. What this means is that, for the planting date and EOS date you selected, you could safely plant a hybrid with a Pioneer CRM rating of about 112.
PLEASE NOTE: Please understand that ratings for relative hybrid maturity (i.e., CRM, RM, “days to maturity”, etc.) are notoriously inconsistent one seed company to another. Consequently, relationships between hybrid GDD ratings and their relative maturity ratings will vary one seed company to another. I believe the relationships listed in Table 2 are valid for Pioneer’s lineup of hybrids, but cannot make the same claim for any other seed company’s lineup of hybrids. Consult your seed dealer!
Caveats (e.g., disclaimers)
Recognize that actual GDDs deviate year to year from the historical “norm” because of natural variability in growing season temperatures. Also recognize that hybrids undoubtedly vary in their GDD response to delayed planting. Also recognize that hybrid GDD response to delayed planting in other parts of the country may differ from what we have documented in the eastern Corn Belt.
Related Reading
National Climatic Data Center. 2013. Climate Normals Online. Advanced Access to 1981-2010 US Normals Data. <http://gis.ncdc.noaa.gov/map/viewer/#app=cdo&cfg=cdo&theme=normals&layers=
01&node=gis&extent=-149.3:20.2:-60.1:69.6&custom=normals> [URL accessed May 2013]
Nielsen, R.L. (Bob). 2012a. Heat Unit Concepts Related to Corn Development. Corny News Network, Purdue Univ. [online] <http://www.kingcorn.org/news/timeless/HeatUnits.html> [URL accessed Apr 2013].
Nielsen, R.L. (Bob). 2012b. Interpreting Corn Hybrid Maturity Ratings. Corny News Network, Purdue Univ. [online] <http://www.kingcorn.org/news/timeless/HybridMaturity.html> [URL accessed Apr 2013].
Nielsen, R.L. (Bob). 2013. The Planting Date Conundrum for Corn. Corny News Network, Purdue Univ. [online] <http://www.kingcorn.org/news/timeless/PltDateCornYld.html> [URL accessed Apr 2013].
Nielsen, Robert L., Peter R. Thomison, Gregory A. Brown, Anthony L. Halter, Jason Wells, and Kirby L. Wuethrich. 2002. Delayed Planting Effects on Flowering and Grain Maturation of Dent Corn. Agron. J. 94:549-558.
Weather Channel. 2013. Growing Degree Days Calculator. The Weather Channel. [online] <http://www.weather.com/outdoors/agriculture/growing-degree-days> [URL accessed Apr 2013].
![]()
Weather Outlook by NWS OHRFC – (James Noel, NOAA/NWS/Ohio River Forecast Center) –
As we discussed last week, a complex weather system will move in from the west with energy splitting south and north of the Hoosier State. Even though the heaviest rain will focus in the cornbelt from eastern Iowa into Illinois, it looks like parts of Indiana will also be pulled into some heavy rainfall through the weekend. The state will be cut in half with some heavy rain in the 1-4 inch range in the southwest half of the state while the northeast half will see about 0.25 to 1 inch on average through May 6.
After above normal temperatures start May, temperatures will relax toward normal if not slightly below normal through mid May. Rainfall will also relax from above normal to around normal.
With a relaxation toward normal into mid May, planting prospects should begin to improve slowly. Once crops are in the ground, most data continues to suggest a much better growing year than 2012 was. The only bad news for Indiana is other areas like Ohio are already in much better shape for planting than Indiana is currently.
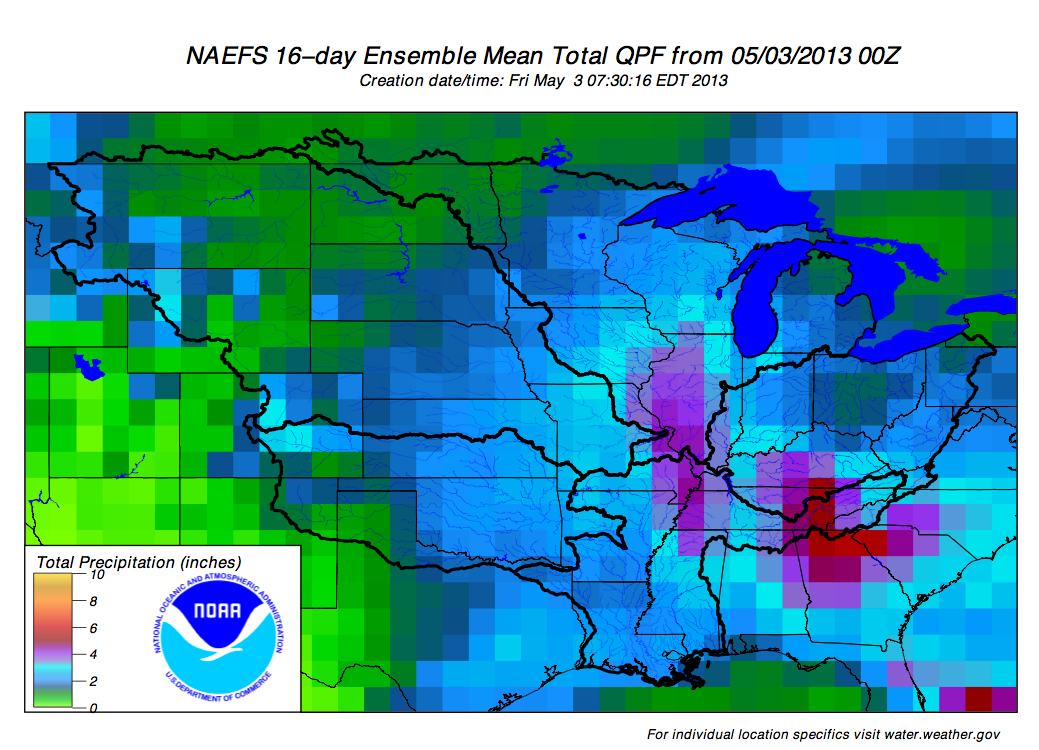
The latest two week ensemble average rainfall outlook can be seen at the National Weather Service Ohio River Forecast Center website anytime at: <http://www.erh.noaa.gov/ohrfc/HAS/images/NAEFS>..
![]()

![]()