
Pest & Crop Newsletter, Entomology Extension, Purdue University
Western Bean Cutworm Moth Captures, 2012 – (Christian Krupke and John Obermeyer)
• Average/trap moth numbers substantially lower than last two years.
• Peak flight earlier than in past years (heat-driven).
• Finding egg masses and larva have been a challenge, like last year.
As the western bean cutworm moth flight ends the season, our dutiful pheromone trap cooperators deserve a hearty thank you for the efforts (Fig. 1) and the information they provide in attempting to better understand this pest in Indiana. Figure 2 summarizes their efforts in comparing average trap catches from 2010 to 2012. The difference in years highlight how important temperatures are in driving moth emergence, and how critical it is that we keep using pheromone traps for insects like these.
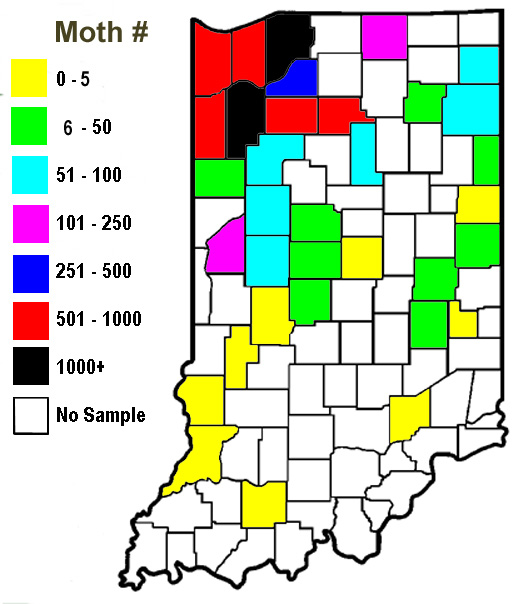
Fig. 1. Highest WBC trap capture by county
No surprise, like all insects this year, western bean cutworm was early out of the “gate,” but then faded quickly. When looking at average moths captured per trap, 2012 numbers were significantly lower than the two previous seasons. As we addressed a few weeks back in the Pest&Crop, the mild winter, followed by the extremely hot summer temperatures appears to have NOT favored this insect pest.
Like last year, egg masses were very hard to find, and subsequent reported damage has been very spotty. This was obvious when during peak flight, we sent crews to fields near high moth catches to harvest egg masses for field trials and struggled to find them. Similar observations were reported by industry agronomists that scouted fields weekly. This is very good news to producers, but frustrating for researchers wanting to further study this pest.
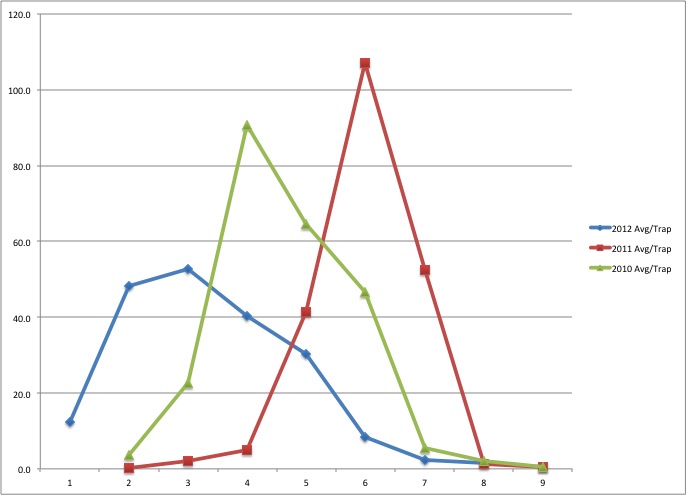
Fig. 2. Average western bean cutworm capture by trap
The three-year comparison graph (Fig. 2) shows that peak moth flight was about 3 weeks earlier than last year. Each of the last three years have been quite unique, with 2010 being warm early in the season, 2011 cooler than normal, then this year’s incredible heat that started in March. The lack of synchrony of corn development and moth flight, combined with high temperatures and drought certainly played a big role in lowering infestations this year.
Though there are undoubtedly larvae surviving out there somewhere, it looks as though that threat will be much less in 2013 – fewer larvae = fewer adults for next year. This strange season only further complicates our understanding and predictability of this insect. Based on this season’s reports, it’s status as a significant “pest” of Indiana corn production is in doubt. Flashback to 2010, and it looked like a new key pest for northern Indiana was here to stay. It shows us, yet again, how unpredictable biology can be, this time in a good way!
![]()
Click here for the Blacklight Trap Catch Report
Sudden Death Syndrome in Soybean Appearing in Indiana – (Kiersten Wise)
Sudden death syndrome, or SDS, has been observed in soybean fields in Indiana over the last few weeks, particularly in northwest Indiana. The fungus that causes SDS, Fusarium virguliforme, infects soybean early in the growing season, and symptoms are typically expressed later in the growing season. The symptoms of SDS may be difficult to identify this year since many fields were drought stressed through June and July and are only now starting to recover. Growers should be watching for symptoms of SDS in fields over the next few weeks, and correctly identify the disease from other issues that are common in 2012, such as charcoal rot, drought stress, and nutrient deficiencies.
Symptoms of SDS are expressed as interveinal yellowing and necrosis (Figure 1). Veins of symptomatic leaves will remain green. Leaflets may curl or shrivel and drop off with only the petiole remaining attached. If symptomatic plants are pulled from the soil and split down the stem, the lower stem will have a dark or discolored cortex, while the pith will remain white or light brown. Drought stressed plants, or fields affected by charcoal rot may have interveinal leaf dieback, yellowing, or plant defoliation which is easily confused with the symptoms of SDS (Figure 2). For information about how to identify charcoal rot, please reference our previous Pest and Crop newsletter article: <http://extension.entm.purdue.edu/pestcrop/2012/issue16/index.html#scout>.
SDS is a disease that is best managed through preventative methods. Producers are encouraged to plant varieties that are less susceptible to SDS in fields with a history of the disease. SDS is typically more problematic in early-planted soybeans, and we are seeing the disease appear in many fields that were planted in mid to late April. Planting fields with a history of SDS last may reduce the risk for SDS. Foliar fungicide applications are not recommended for management of SDS.
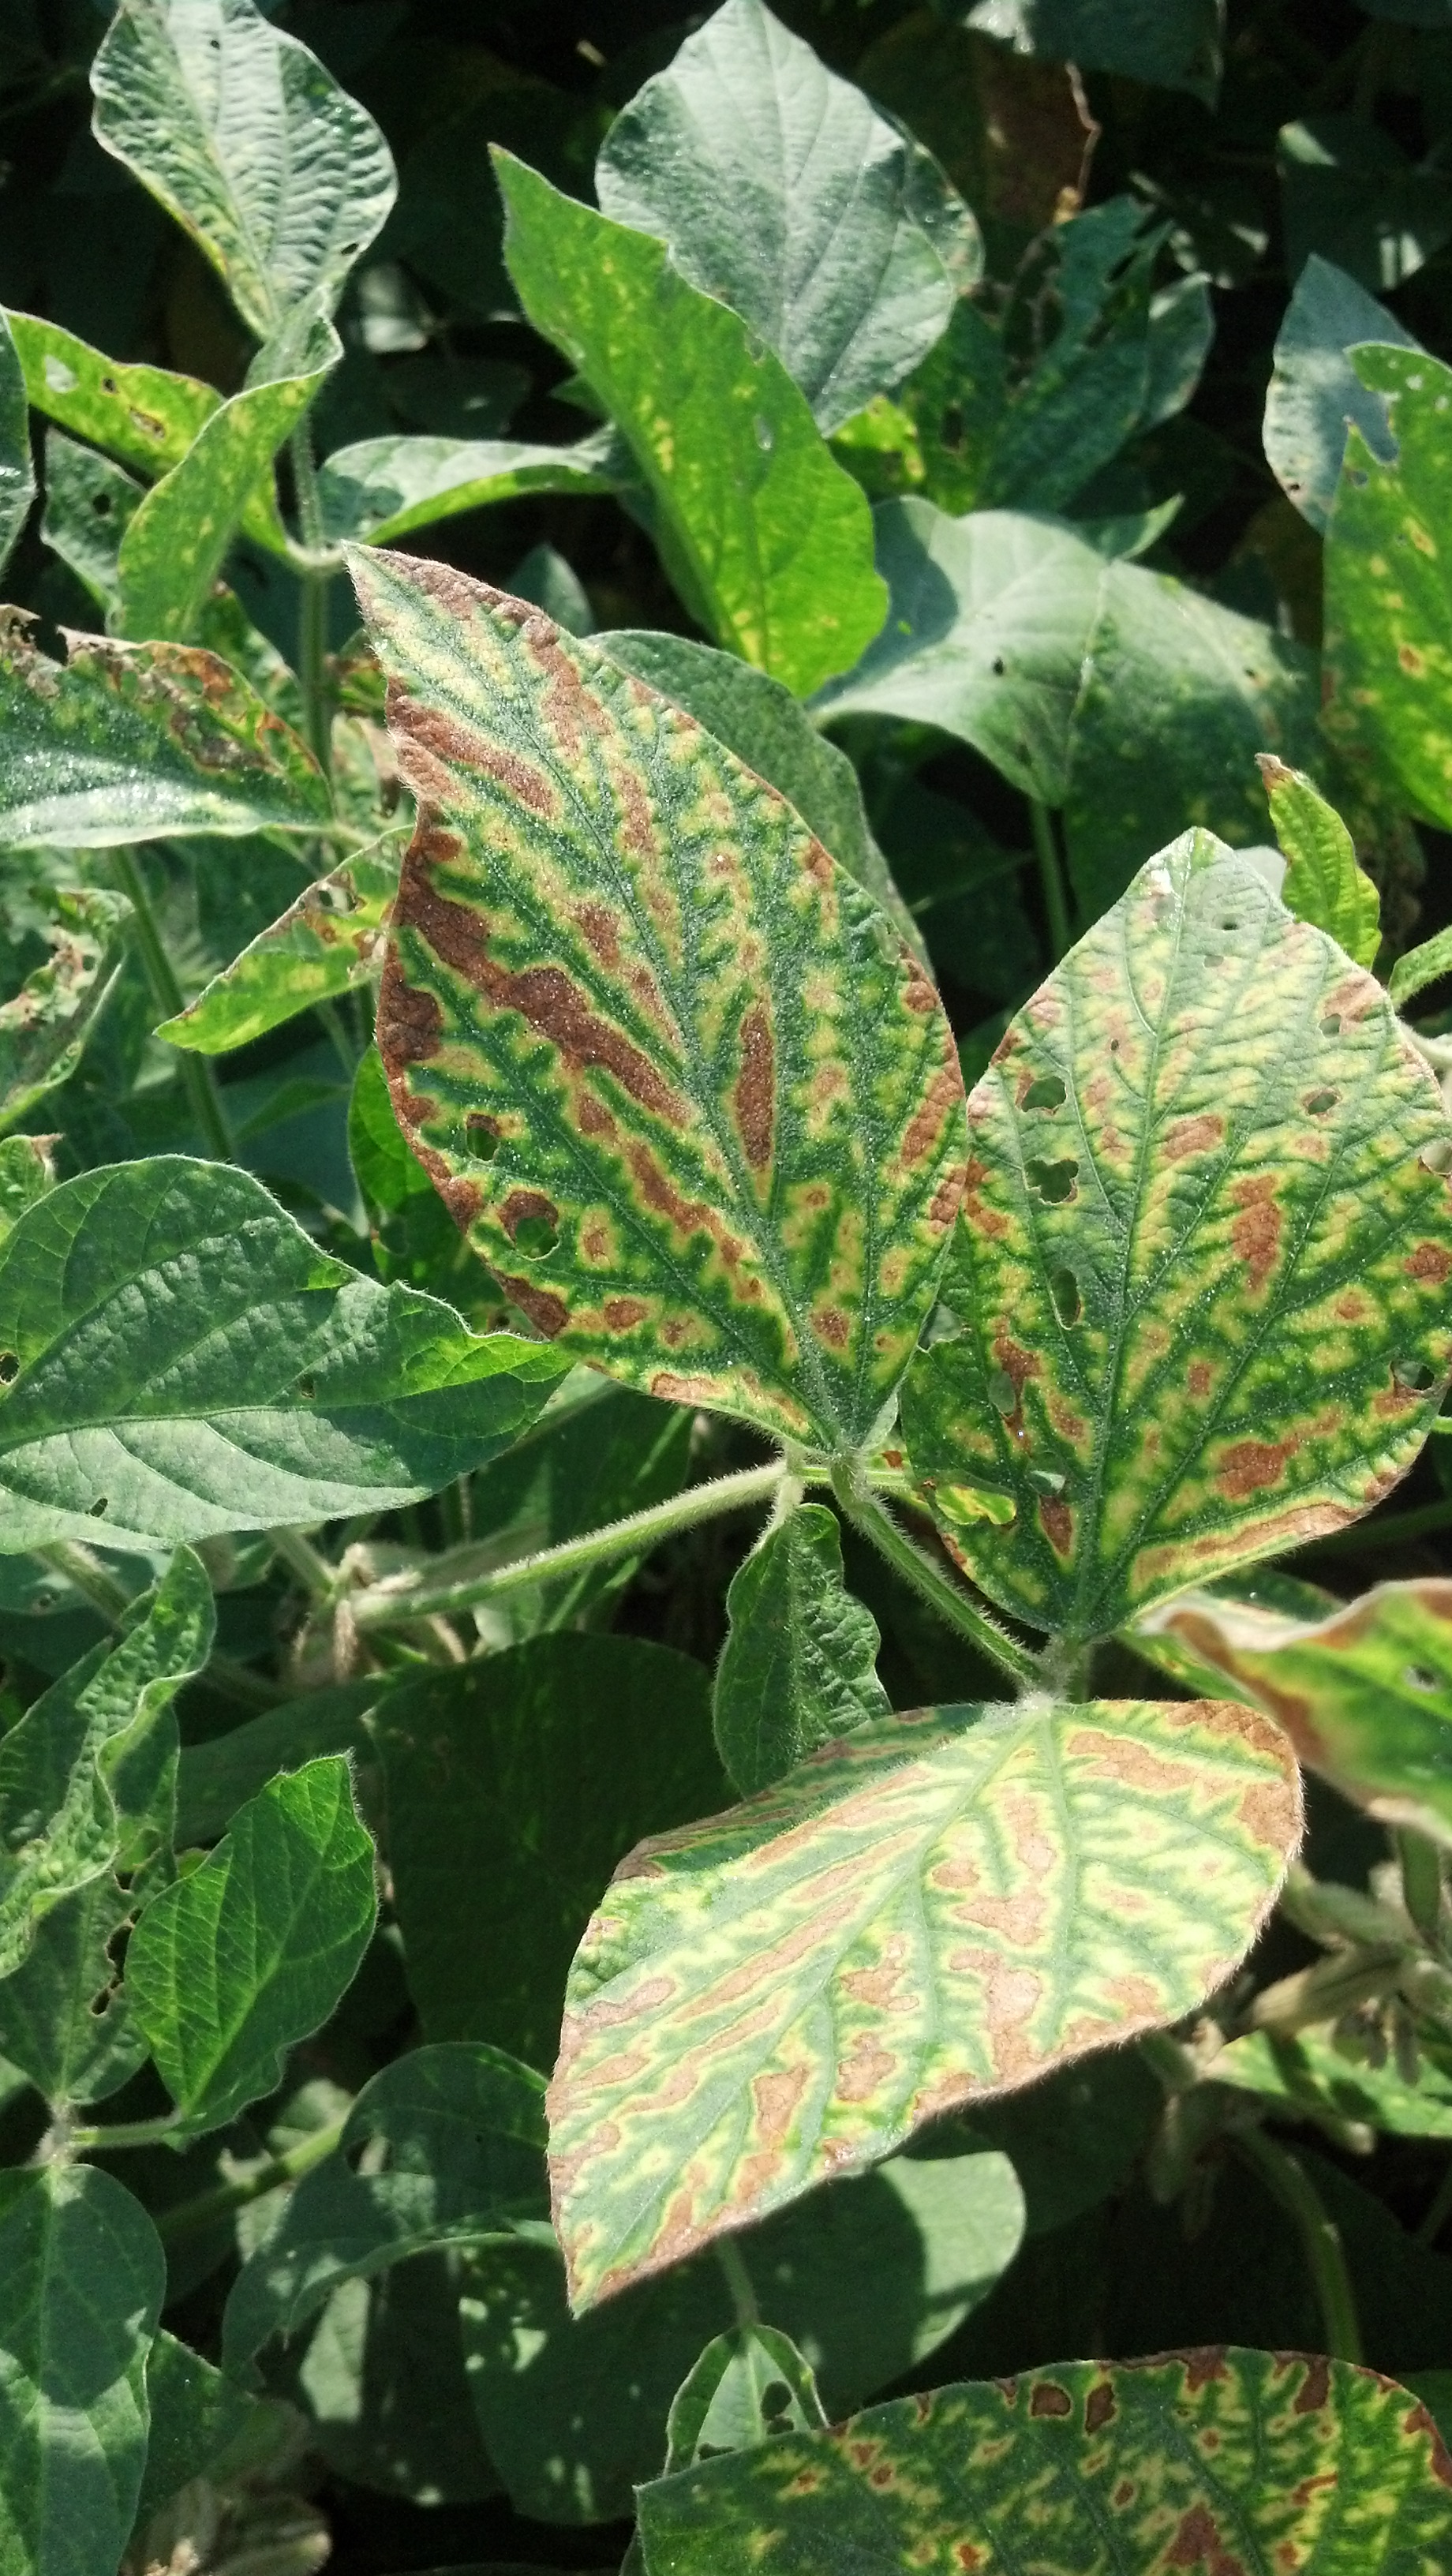
Fig. 1. Foliar symptoms of sudden death syndrome (SDS) on soybean leaves
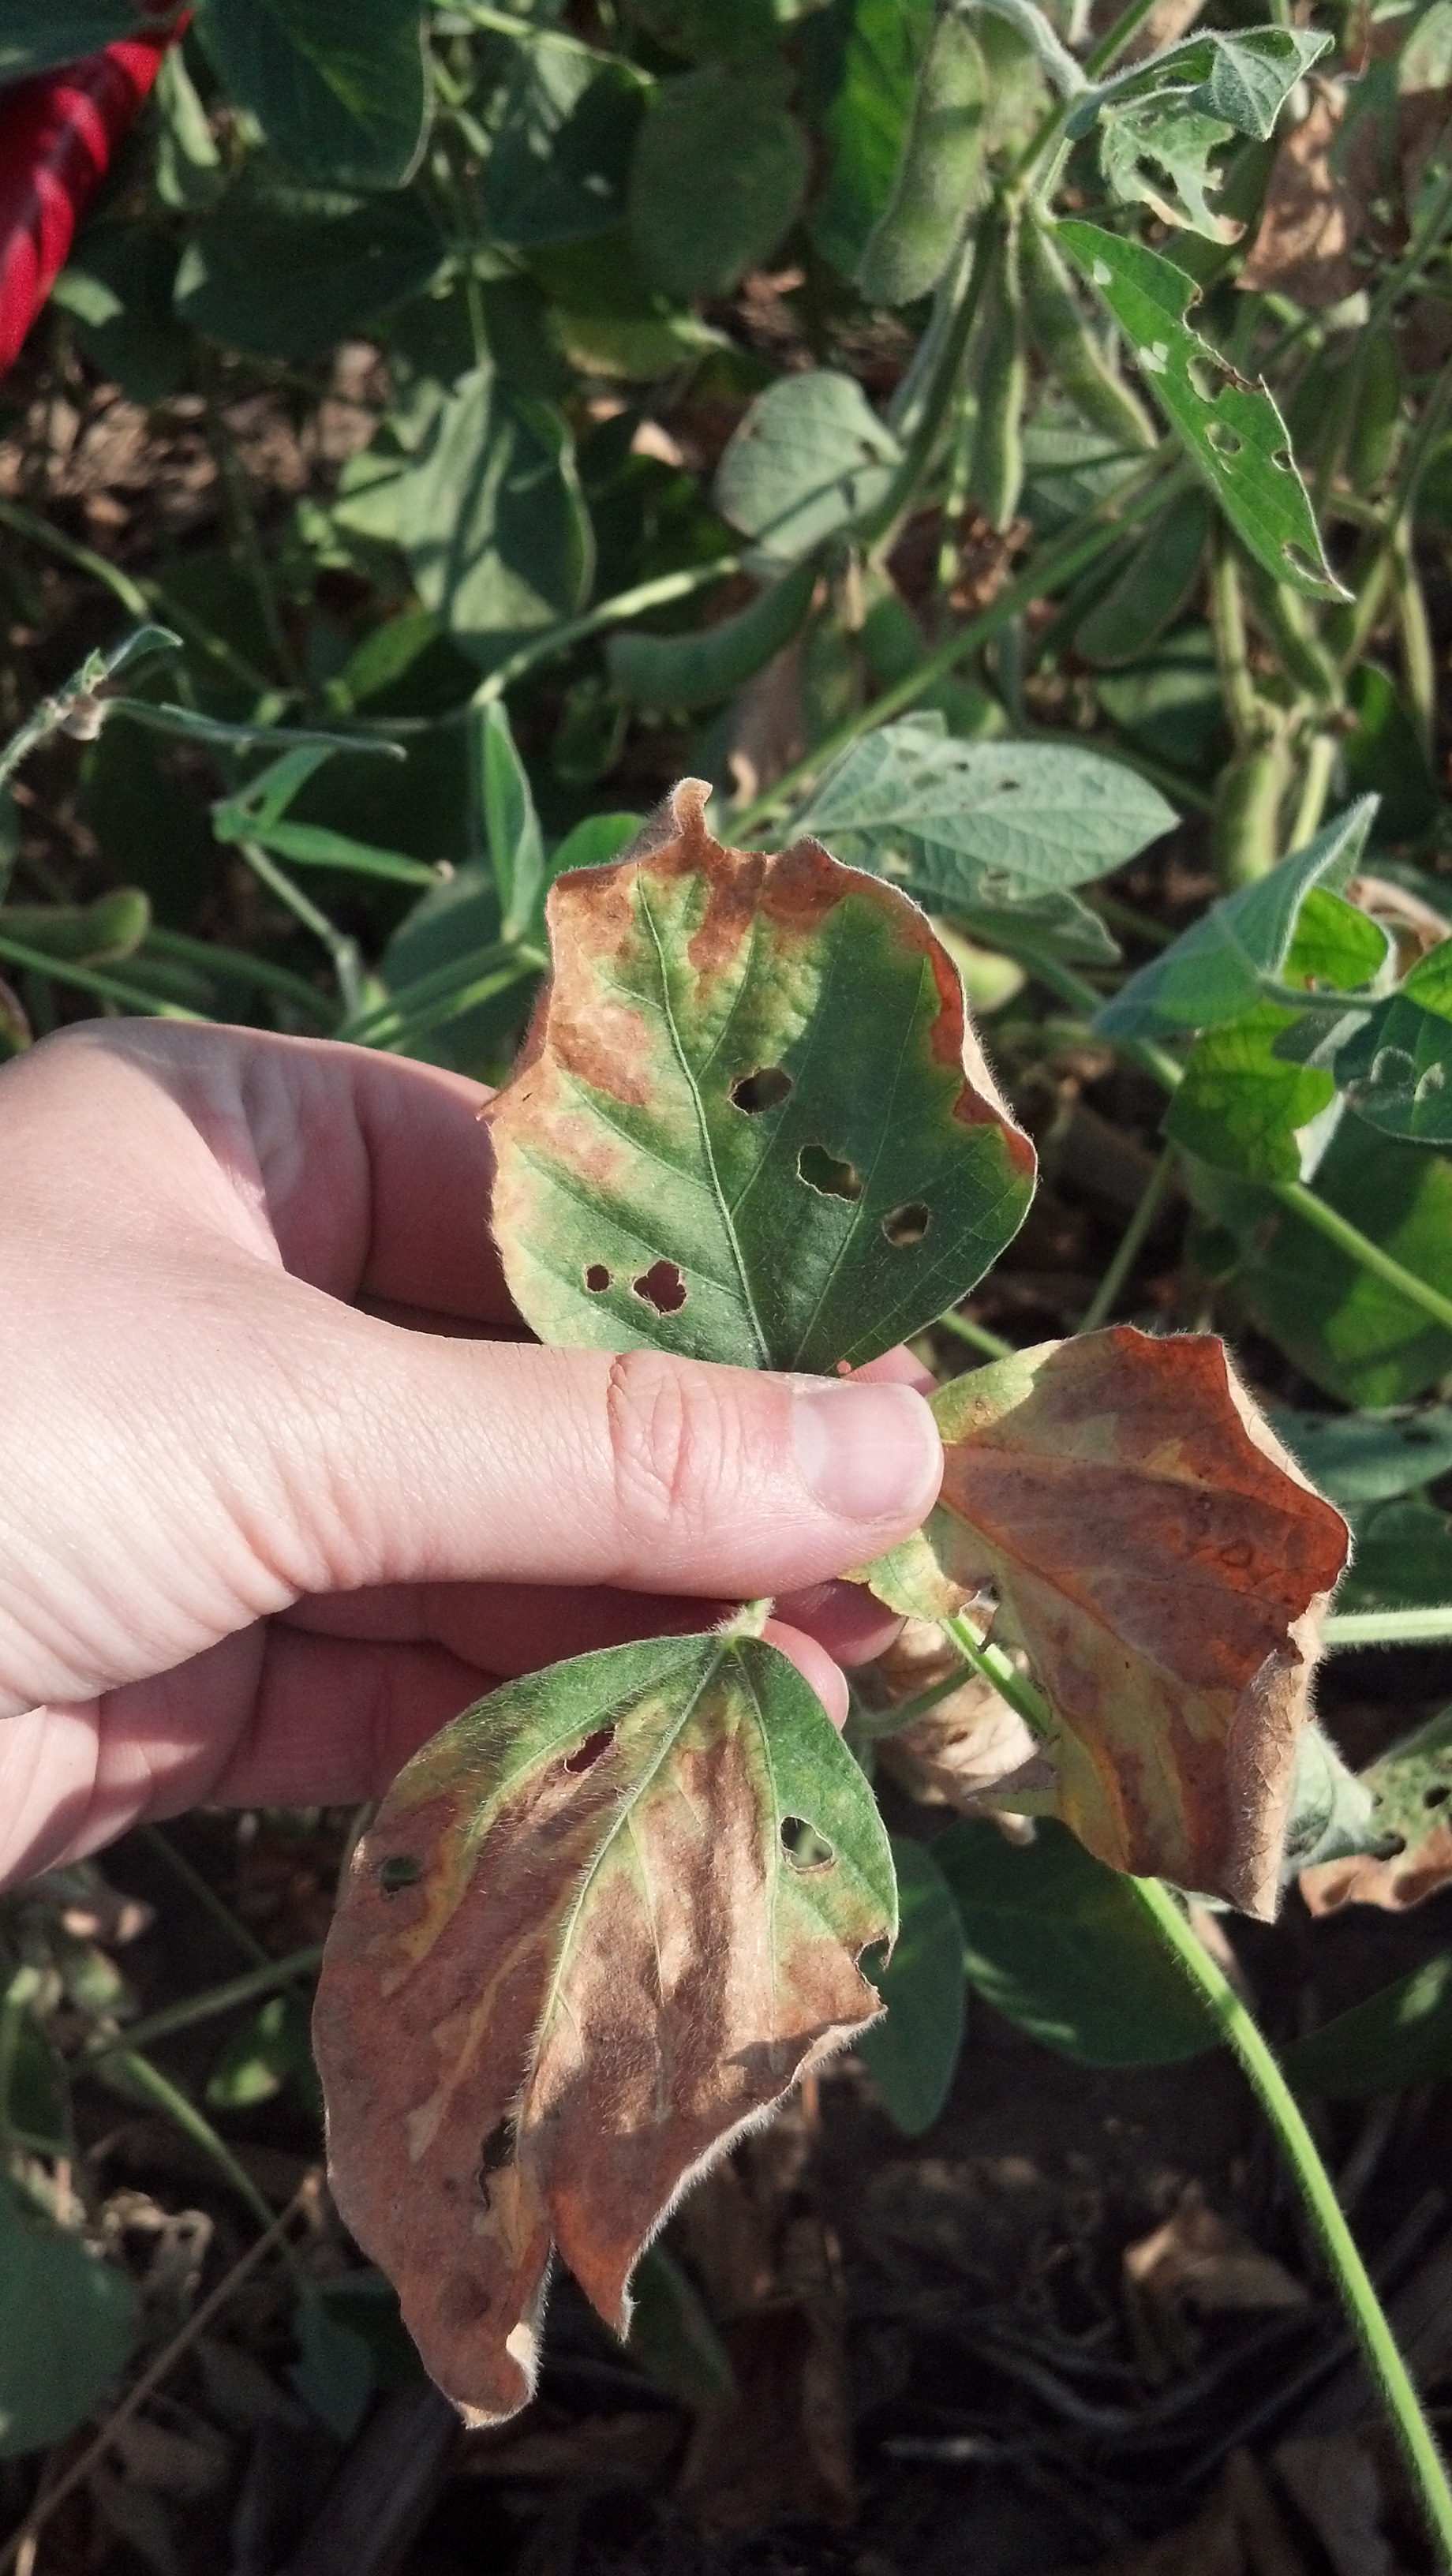
Fig. 2. Drought stressed soybean leaves may have symptoms that resemble SDS
Estimating Soybean Yields – Simplified - (Shaun N. Casteel) -
Estimating soybean yields prior to harvest can be frustrating and somewhat unreliable. Soybeans have a great ability to compensate for various growing conditions. Early to mid-season stresses can limit the number of pods that are retained. The potential number of seeds per pod is driven by growing conditions shortly after flowering no matter the growth stage. In other words, stressful conditions can trigger the development of 1- or 2-seeded pods rather than 3- or 4-seeded pods. Favorable conditions during seed fill will not increase the number of seeds in advanced pods (seed number already determined), but stressful conditions can arrest seed development and reduce the number of seeds in a pod. However, favorable conditions can lead to more pod production and retention as has been seen in many areas with the rains over the past few weeks. Late season rains can also increase yield by extending seed fill and the final size of the seeds.
Pod number, seeds per pod, and seed size are the driving forces of soybean yield. The combination of these factors allows soybean to adapt to growing conditions over long periods (weeks and even months) and still yield well. Though, these same factors can make it difficult to estimate soybean yields prior to harvest.
When Should I Take Yield Estimates?
Any yield estimate improves as you get closer to harvest – soybean or corn. The confidence level increases because the plants have responded to more of the growing season (pod retention, seeds per pod, and seed size). Soybean yield estimates can begin as soybeans enter into R5 (first seed, Figure 1). At this point, a fair portion of the pods have developed and seeds are filling throughout the whole plant. Flowering will continue at a limited rate and will soon cease. Pod development (retention and number of seeds per pod) will lag behind the pattern of the flowering. The yield potential at this point can be low or it can be high depending on the remaining 4 to 6 weeks of the growing season. Yield estimates will improve as the plants continue developing over the following ~15 days and enter R6 (full seed, Figure 2), which last another ~20 days. Pod retention and seeds per pod will become clearer, and the potential for large, average, or small seeds will be more discernible.

Figure 1. Soybean at R5 (first seed). Seeds are 1/8 inch long in one of the pods at the top 4 nodes.
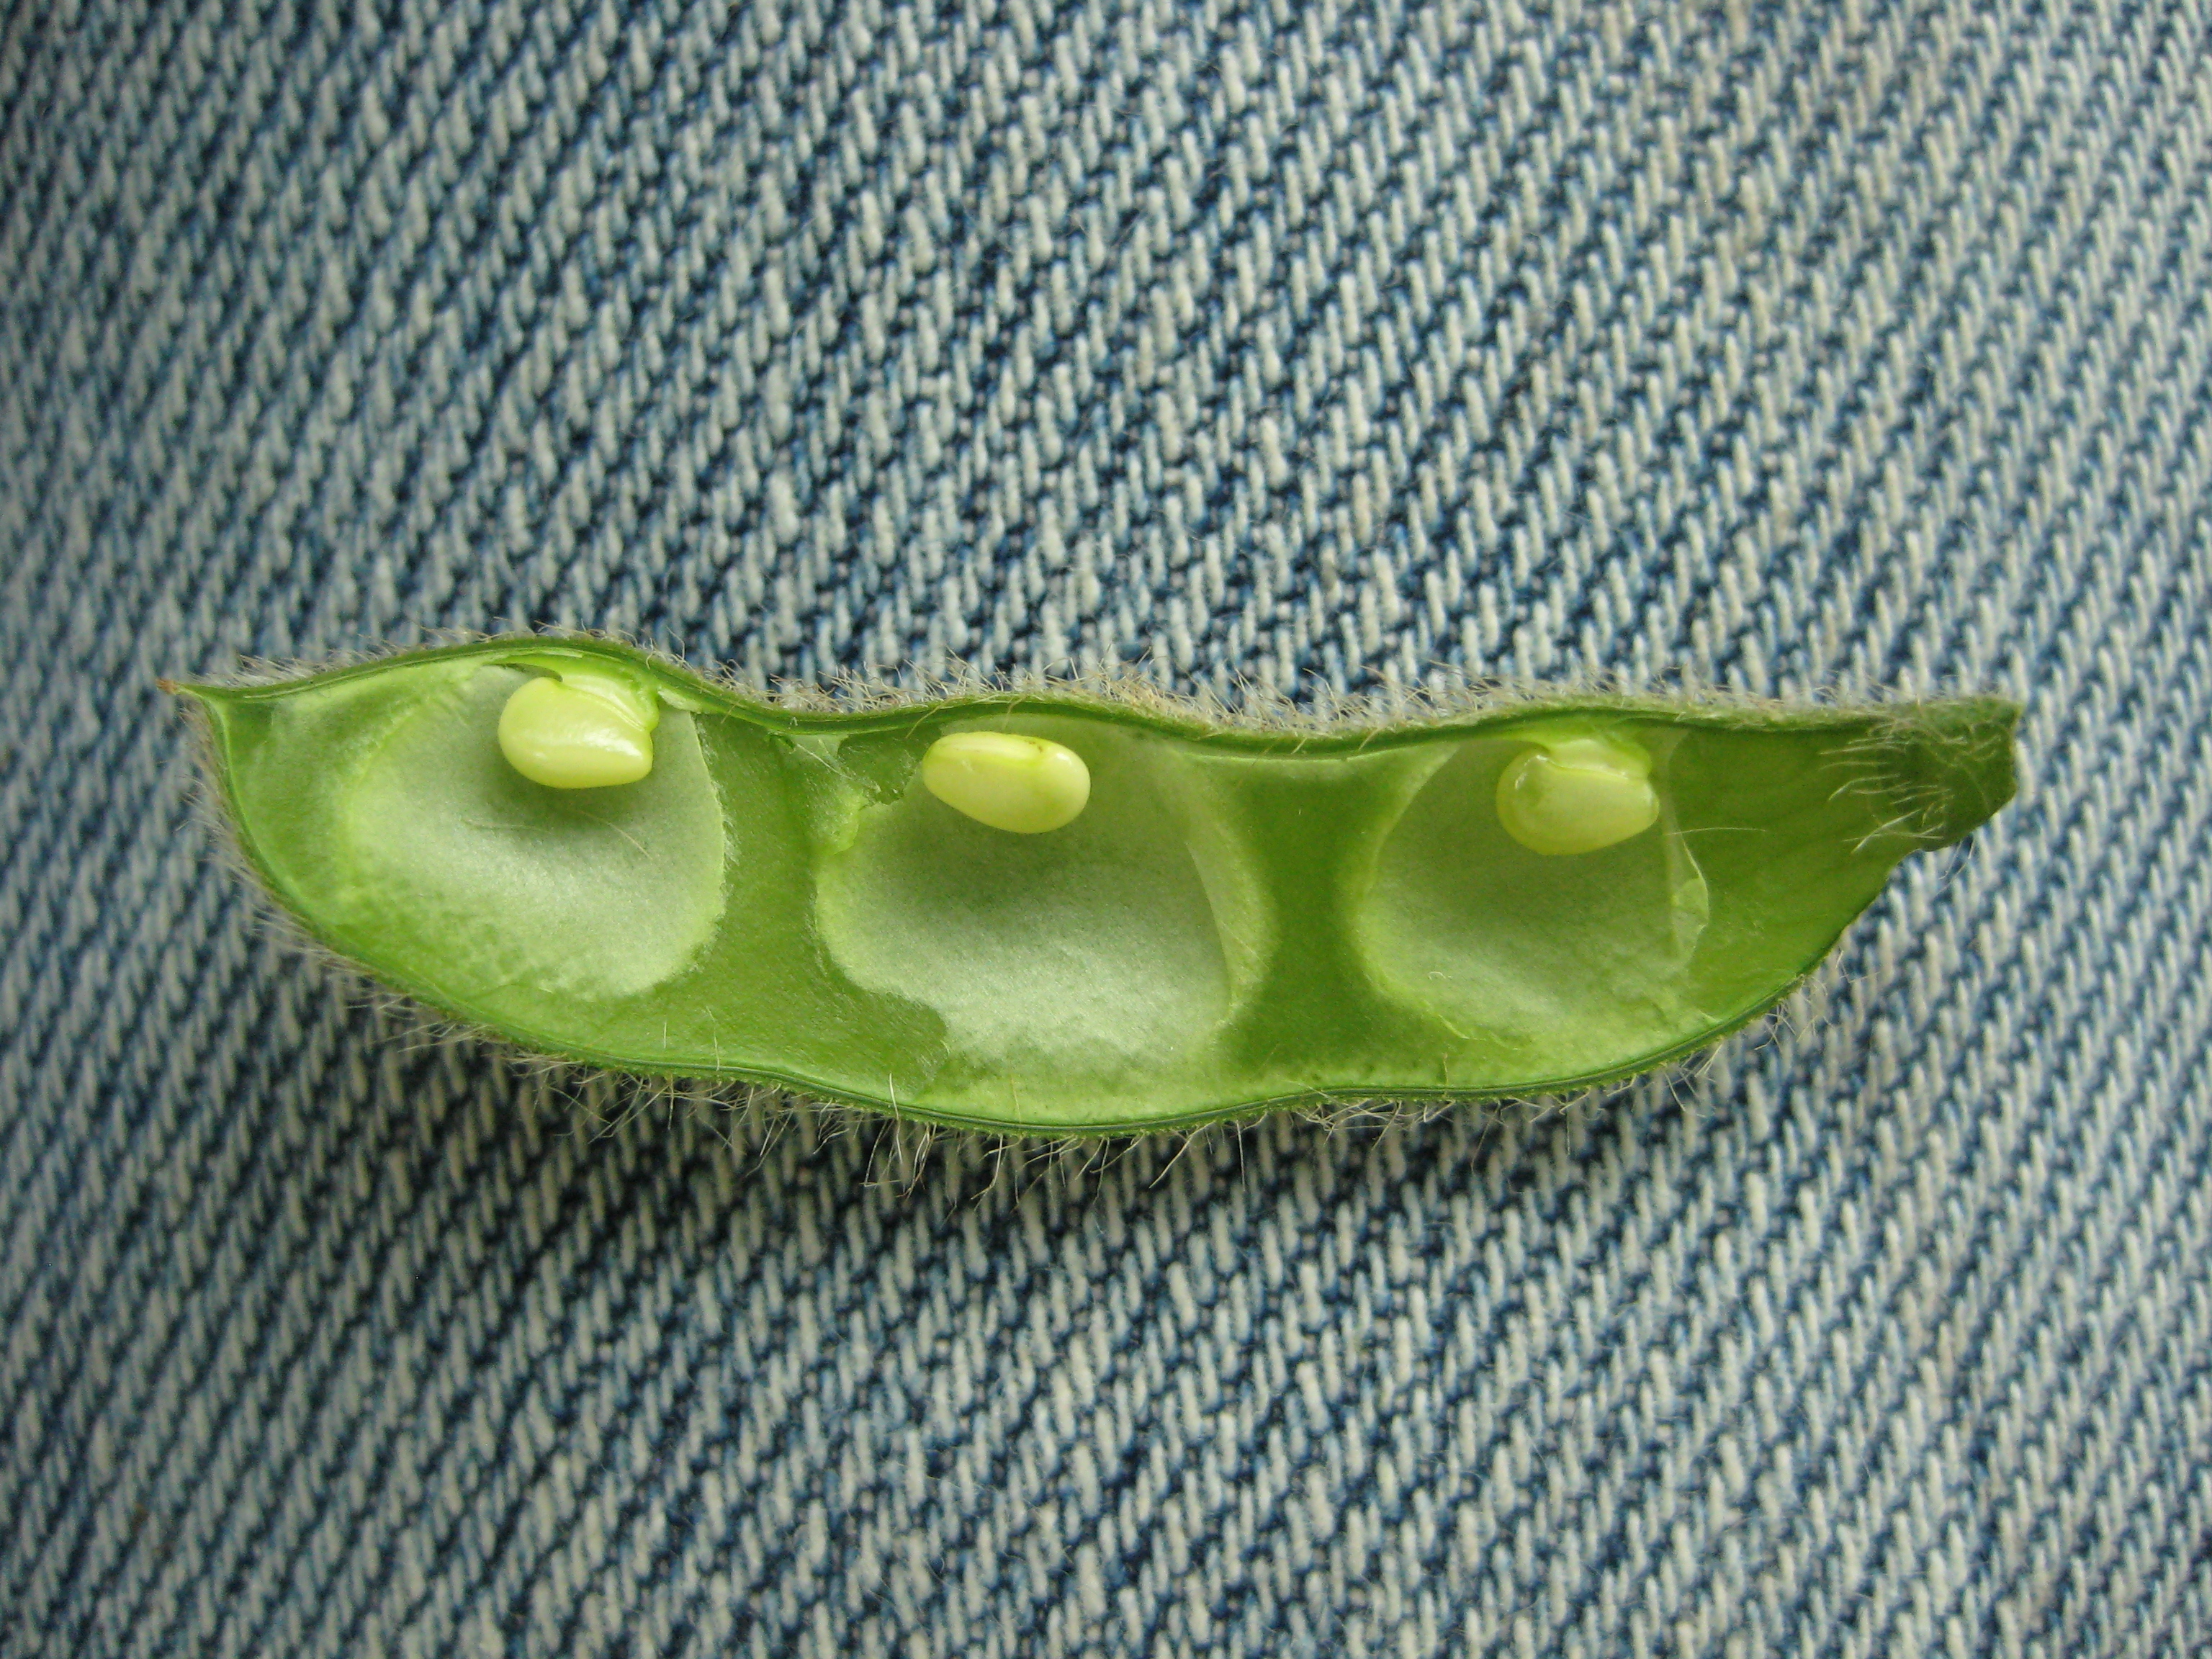
Figure 1. Soybean at R5 (first seed). Seeds are 1/8 inch long in one of the pods at the top 4 nodes.
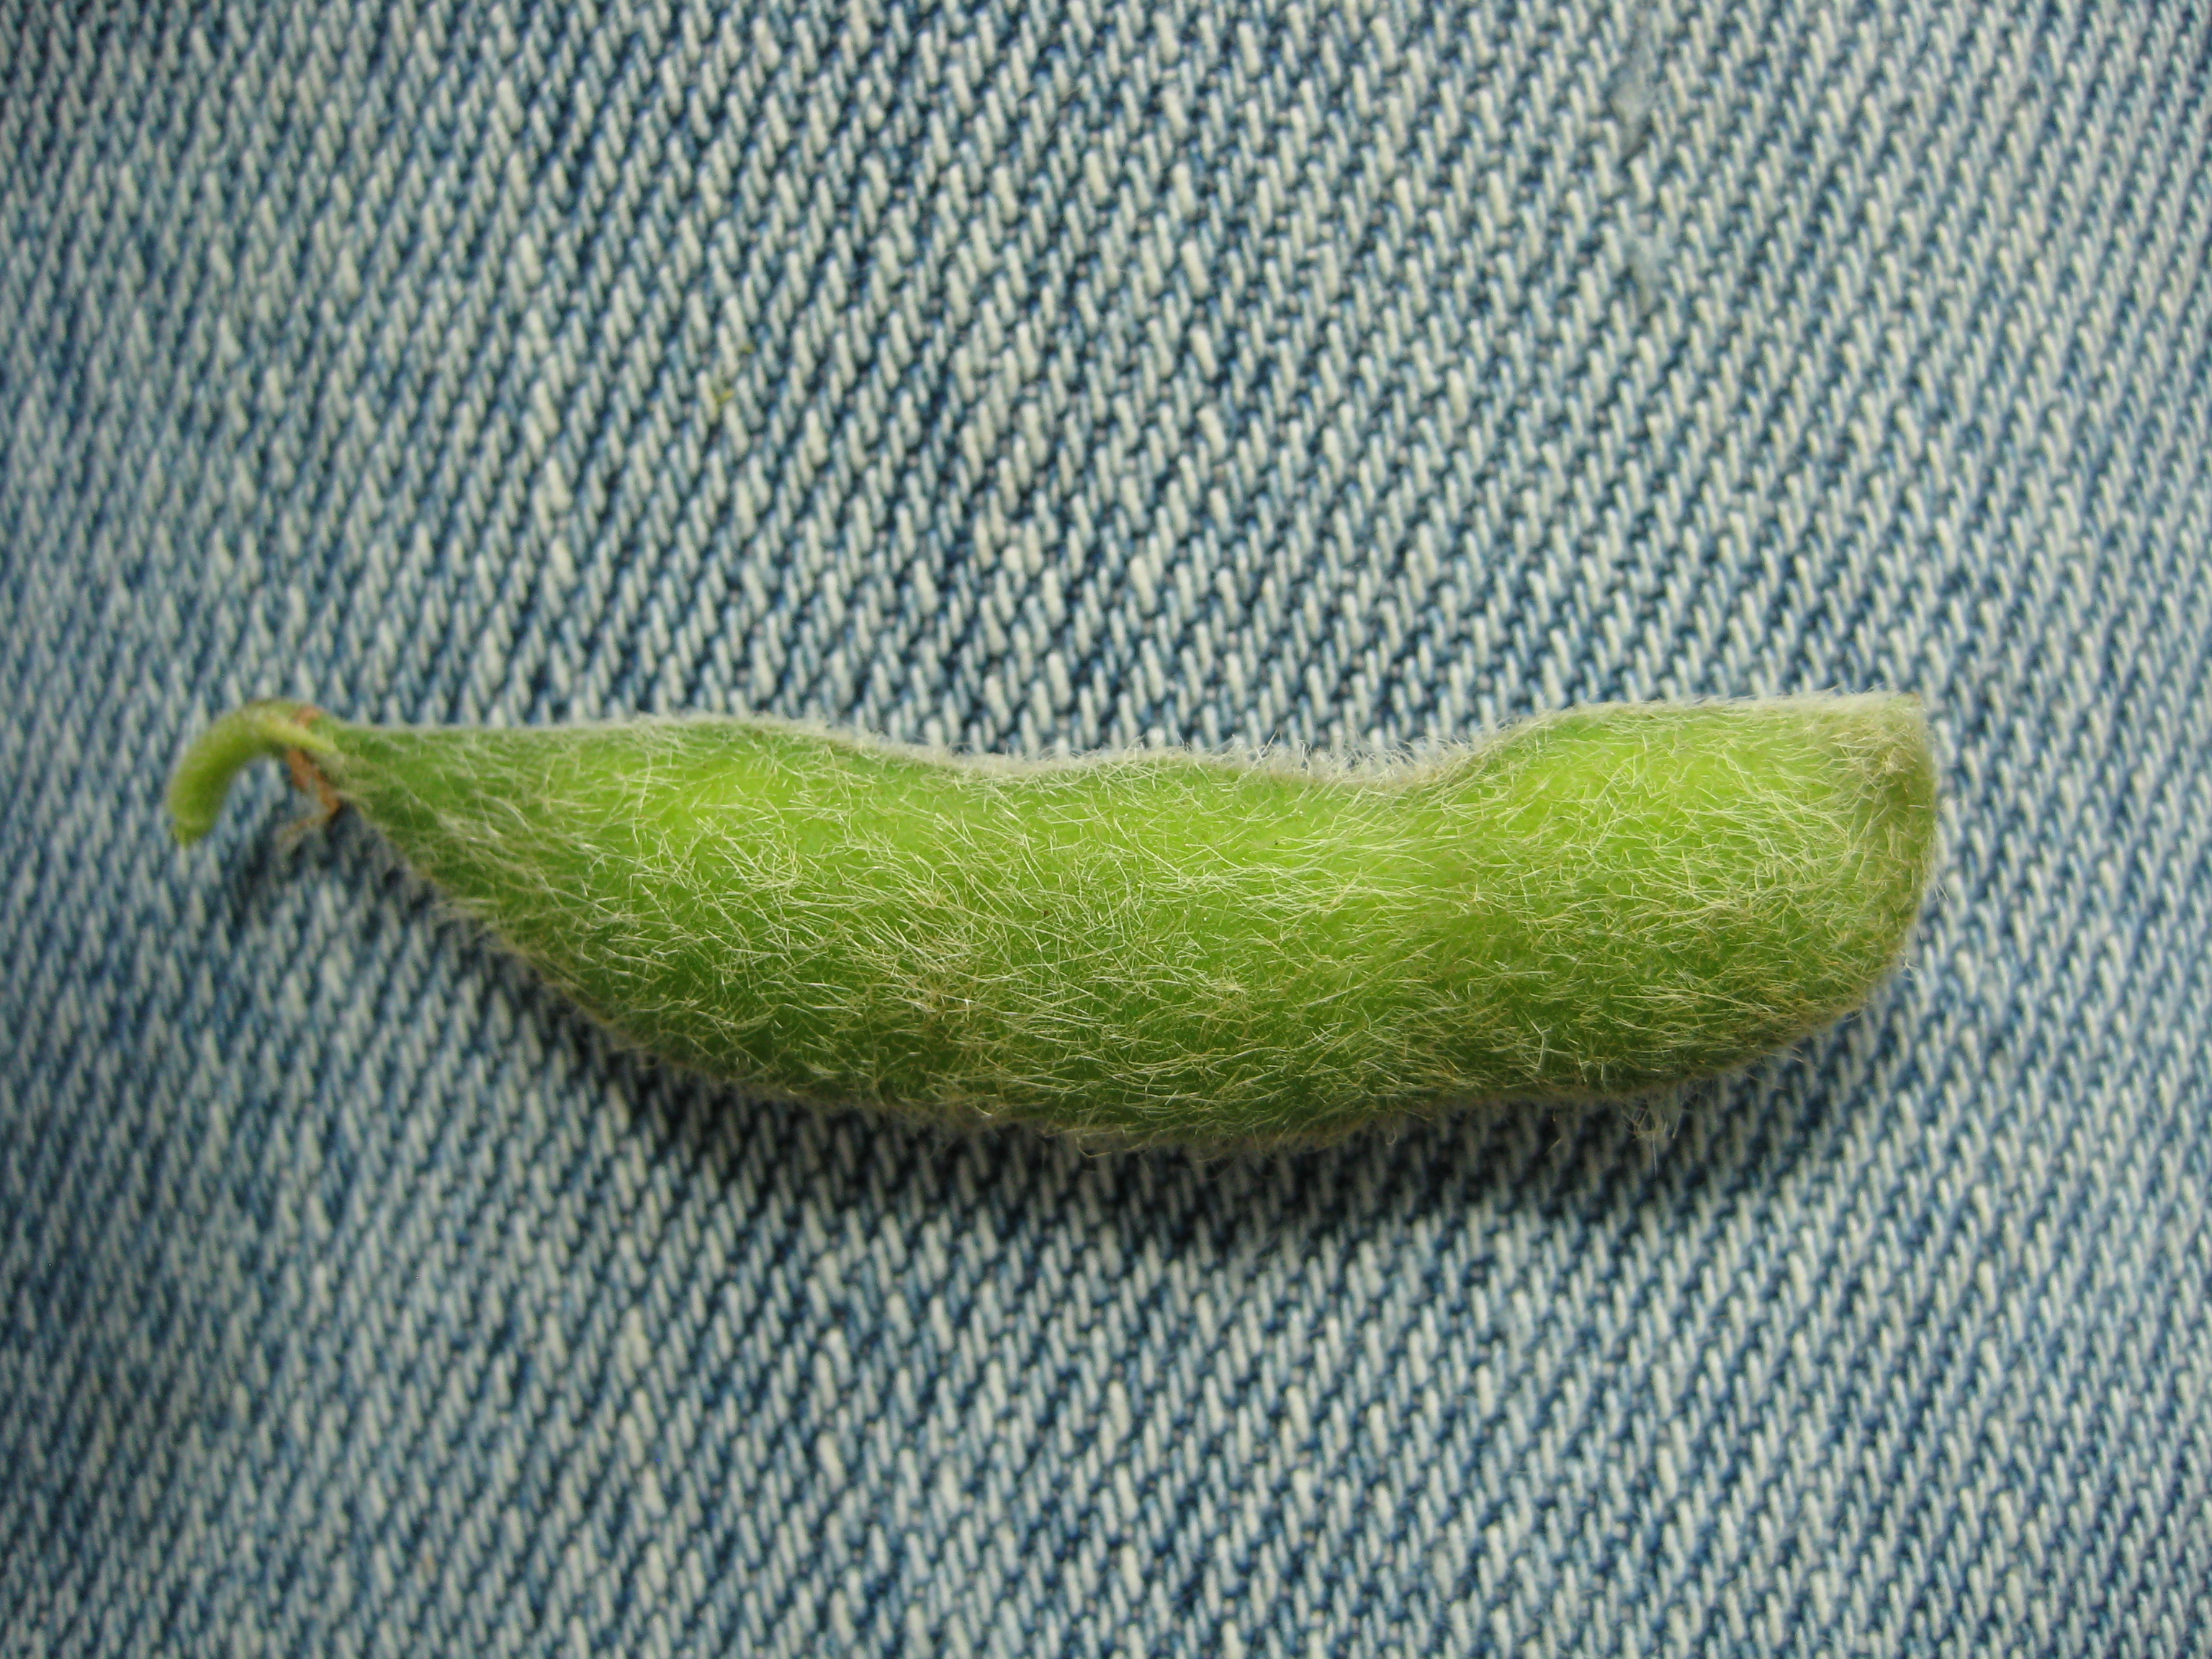
Figure 2. Soybean at R6 (full seed). Seeds filling the pod capacity in one pod at top 4 nodes.

Figure 2. Soybean at R6 (full seed). Seeds filling the pod capacity in one pod at top 4 nodes.
Problem With Previous Yield Estimate
Pre-harvest yield estimates have included the plant population as a factor since most people do not want to count all the pods in 1/1000th acre. I do not want to count thousands of pods for one yield estimate of one field! Some try to get around the system by determining the plant population then count the number of pods on a couple of plants. This is not reliable or reproducible. The plant-to-plant variability of soybean can be wide due to numerous factors such as plant spacing, pest pressures, and early season development differences. Let’s assume a plant stand of 100,000 plants/acre, and one plant is selected for pod count. If you count the plant that has 25 pods then you would estimate 35 bu/acre. However, if you count the next plant it has 50 pods and the yield estimate would be 70 bu/acre.
Individual plant production will vary and we must take a representative sample without being extraneous. Every field will have variations based on soils, pests, fertility, and other factors. I have simplified the process of estimating soybean yields, so that you can scout multiple areas quickly while maintaining representative estimates.
The system is based on 1/10,000th acre and the following formula:
Pods X Seeds Per Pod ÷ Seed Size Factor = Estimated Bushels Per Acre
Step 1 – Pods
Count the number of pods in 1/10,000th of acre. Yes, 1/10,000th of acre! Nearly 90% of our Indiana soybean acres are planted in 30-, 15-, or 7.5-in rows, so just remember 21. You will count the number of pods in 1 row for 30-in width, 2 rows for 15-in width, or 4 rows for 7.5-in width to equal 1/10,000th acre (Figure 3). Each one of these counts will be 21 inches in length.
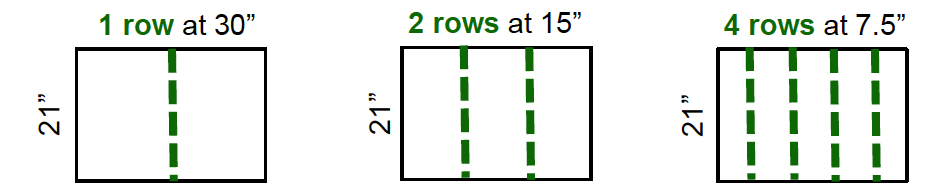
Figure 3. Number of rows to count to equal 1/109,000th of an acre.
We certainly have other row widths, and this simplified system can be adapted to your row width. If you have a different row width, divide 627.26 by your row width (inches) to calculate the linear length (inches) of 1 row to equal 1/10,000th acre. For example, an 18-in row width would require 34.8 inches of 1 row to equal 1/10,000th acre (627.26 18 inches).
This simplified system is more reliable when you have 8 or more plants in the sampled area, which translates to 80,000 plants per acre. If plant stands are less than 8, you should count additional areas to decrease the variability of the overall yield estimate for the field. If you want to have an idea of final plant stand, multiply the number of plants sampled by 10,000. However, you do not need plant population to estimate yield with this approach.
You will count the total number of pods in the 1/10,000th acre. You will need to use discretion to which pods you will include in the count. A good rule of thumb is to count the pods that are greater than 1”, with the knowledge that some of the smaller pods may or may not make it.
Step 2 – Seeds Per Pod
The starting point is an average of 2.5 seeds per pod, since there can be a range of 1-, 2-, 3-, and 4-seeded pods. This value is conservative since we do not know exactly how the rest of the season will finish. The soybean plants may arrest seed development on several 3-seeded pods or some pods are aborted completely. You can quickly increase or decrease the yield estimate by changing this one value. You can more confidently adjust this value because you are more likely to remember the frequency of 2- or 4-seeded pods within a few hundred pods.
Step 3 – Seed Size Factor
The starting point is seed size factor 18, which equals a fairly representative seed size of 3,000 seeds per pound. If you expect larger seeds (maybe from late season rains) you will use a smaller seed size factor such as 15 (2,500 seeds per pound). Similarly if seed fill will be limited (i.e., small seeds) due to lack of water or other late season stresses, you should use a larger seed size factor like 21 (3,500 seeds per pound).
| Table 1. Seed Size Factors. | |
| Seeds Per Pound | Seed Size Factor |
| 2500 (large seed) | 15 |
| 2666 | 16 |
| 2833 | 17 |
| 3000 (normal seed) | 18 |
| 3166 | 19 |
| 3333 | 20 |
| 3500 (small seed) | 21 |

We have soybean yield potential across the board this year from 10 to 60 bu per acre. In fact, some areas will have this range in the same field. The biggest factor will be the number of pods and the seed size, and thus, the examples I provided. Early season drought stress does not mean yields will be devastating nor does great early season growth guarantee good yields. The weather from the last week of July and August will ultimately determine our yield potential.
![]()
Late-Season Hail Damage to Corn – (Bob Nielsen) -
Late-season hail storms can defoliate corn plants, shred leaves, bruise or damage stalks, and bruise or damage ears in fields unfortunate enough to be in their paths. Yield loss from such late season hail damage is due primarily to the defoliation, but the extent of the defoliation can be tricky to quantify. Additional loss of yield or reduction in grain quality can occur from physical damage to the kernels on the ears. Stalk breakage or lodging can interfere with harvest of the damaged fields and result in mechanical harvest losses.
Hail damage to leaves typically looks worse than it really is, because most of us tend to assume tattered leaves will no longer function. This assumption is correct if the tattered leaves eventually dry up and wither away. However, if the tattered leaves don’t actually die, they still contribute to the continued functioning of the photosynthetic factory.
As with hail damage that occurs earlier in the season, the first step in assessing the severity of hail damage to corn is to take a deep breath and keep busy with other things for several days before walking the damaged field. This first step serves two functions. One is to allow yourself some time to calm down. More importantly, the several day wait period will better identify whether shredded, tattered leaves will die or remain green and functional.
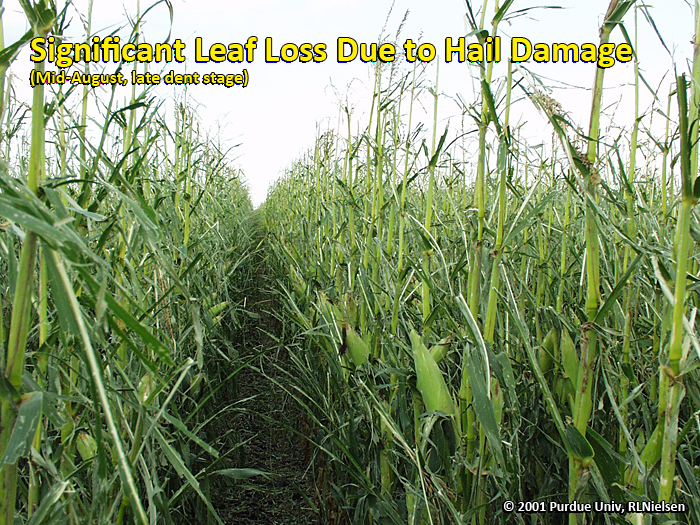
Significant leaf loss due to hail damage

Minor defoliation by hail
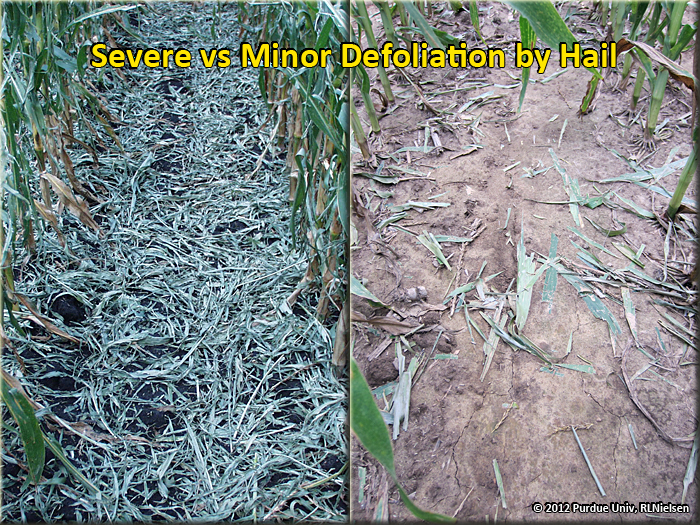
Severe vs minor defoliation by hail
Yield loss to defoliation is dependent on the growth stage of the crop. The greatest potential yield loss due to defoliation exists at the critical pollination period and becomes increasingly less the closer the crop gets to grain maturation (kernel black layer). Corn loss tables published by National Crop Insurance Services that list expected yield loss to defoliation at varying growth stages are reproduced in our ID-179 Corn and Soybean Field Guide if you have a copy of that publication or in the Klein & Shapiro (2011) publication from the Univ. of Nebraska.

Live vs dead tattered leaves
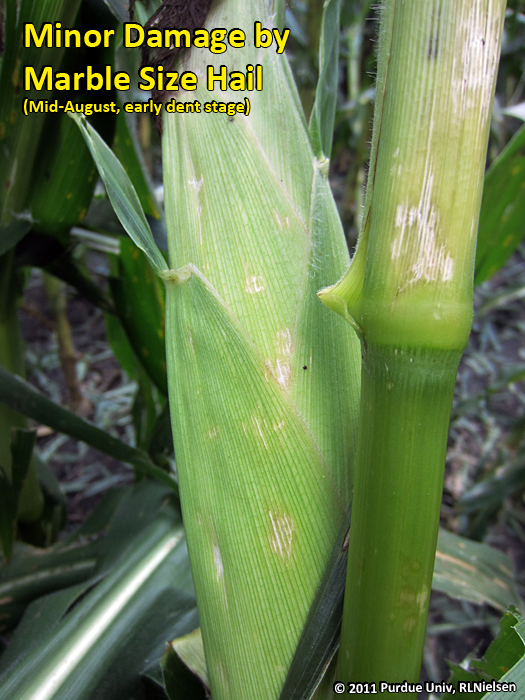
Minor damage by marble size hail
Minor bruising of the stalk or ear husks will be of little consequence and should not result in any appreciable risk of stalk or ear rot development. Where hailstones are large or intense enough to actually gouge into the stalk, then the physical structural integrity of the stalk is compromised and standability may become an issue before harvest.
Hailstorms that also pack quite a bit of wind can cause significant stalk breakage and lodging, especially where the corn rows are oriented perpendicular to the direction of the wind. In fields where root depth or strength is compromised by other stresses, the driving impact of a severe hail storm may literally uproot plants.
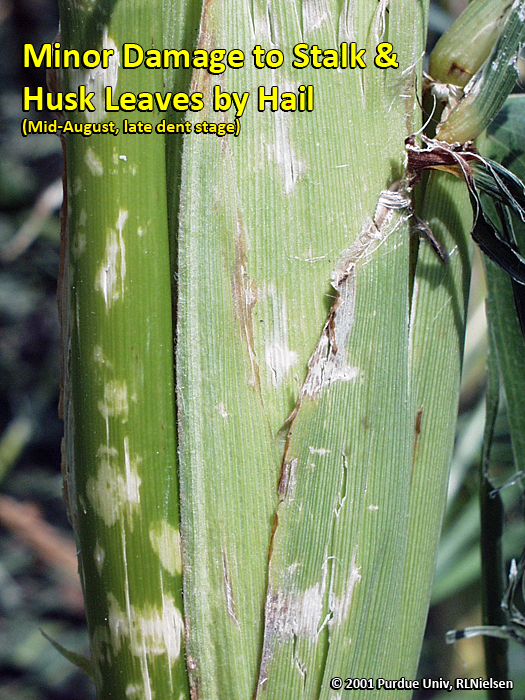
Minor damage to stalk & husk leaves by hail
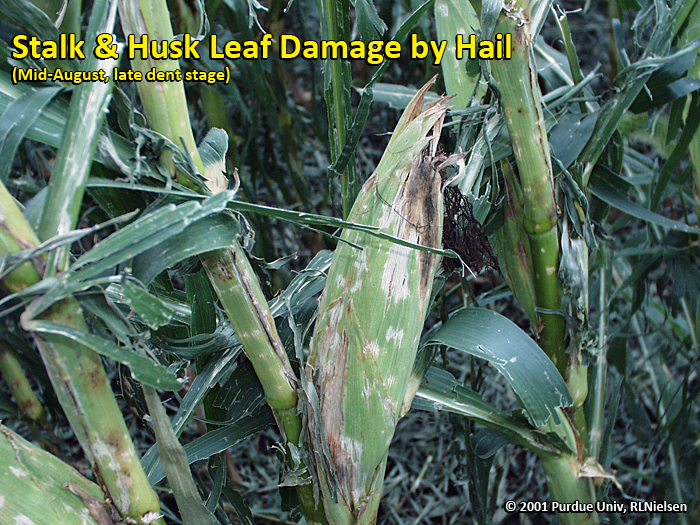
Stalk & hust leaf damage by hail
A minor bit of good news with late-season hail damage is that significant defoliation in hail-damaged fields may actually contribute to faster grain drydown because of greater wind movement through the damaged crop canopy. Grain maturation timing may be hastened a bit, also.
Related Reading
Corn & Soybean Field Guide. 2012. Purdue Univ. Available to order at <http://www3.ag.purdue.edu/agry/dtc/Pages/field-guide.aspx> [URL accessed Aug 2012].
Klein, Robert and Charles Shapiro. 2011. Evaluating Hail Damage to Corn. Univ of Nebraska Extension Pub. EC-126. <http://www.ianrpubs.unl.edu/live/ec126/build/ec126.pdf> [URL accessed Aug 2012].
Lauer, Joe. 2009. Late-season hail effects on corn. Agronomy Advice, Univ of Wisconsin.<http://corn.agronomy.wisc.edu/AA/pdfs/A069.pdf> [URL accessed Aug 2012].

Stalk obliteration by softball-sized hail

Minor kernel damage by hail

Damage by softball size hail
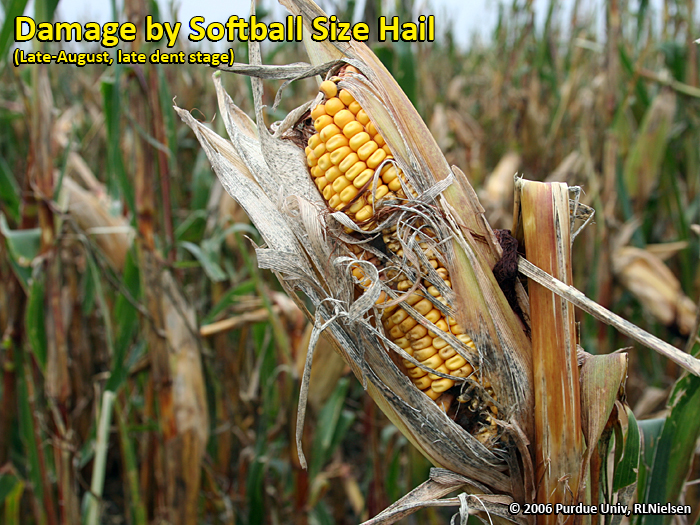
Damage by softball size hail
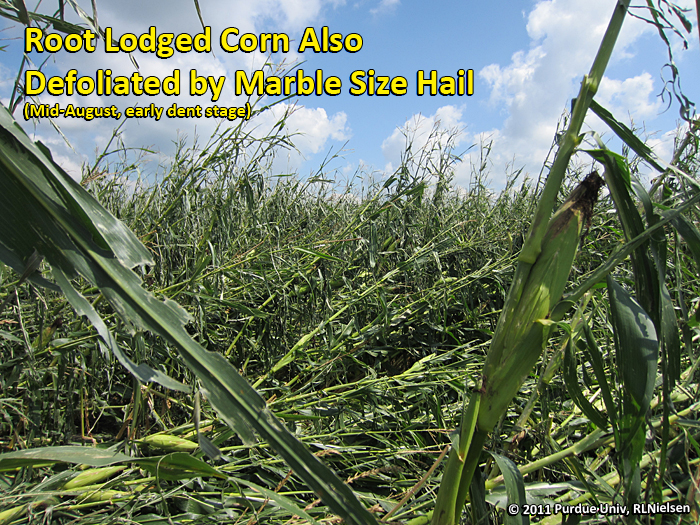
Root lodged corn also defoliated by marble size hail
![]()
Test Weight Issues in Corn – (Bob Nielsen) -
Among the top 10 most discussed (and cussed) topics at hometown cafes during harvest season is the test weight of the grain being reported from corn fields in the neighborhood. Test weight is measured in the U.S. in terms of pounds of grain per volumetric bushel. In practice, test weight measurements are based on the weight of grain that fills a quart container (32 qts to a bushel) that meets the specifications of the USDA-FGIS (GIPSA) for official inspection (Fig. 1). Certain electronic moisture meters, like the Dickey-John GAC, estimate test weight based on a smaller-volume cup. These test weight estimates are reasonably accurate but are not accepted for official grain trading purposes.
The official minimum allowable test weight in the U.S. for No. 1 yellow corn is 56 lbs/bu and for No. 2 yellow corn is 54 lbs/bu (USDA-GIPSA, 1996). Corn grain in the U.S. is marketed on the basis of a 56-lb “bushel” regardless of test weight. Even though grain moisture is not part of the U.S. standards for corn, grain buyers pay on the basis of “dry” bushels (15 to 15.5% grain moisture content) or discount the purchase price to account for the drying expenses they will incur with corn grain wetter than 15 or 15.5% moisture.
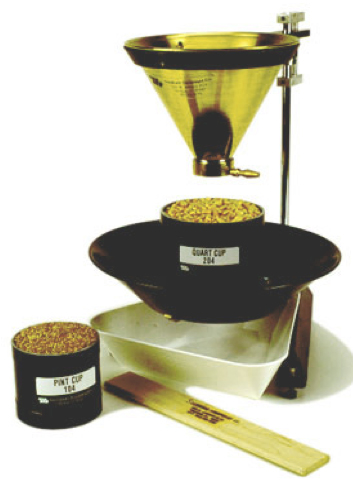
Figure 1. A standard filling hopper and stand for the accurate filling of quart or pint cups for grain test weight determination (Image: www.seeduro.com).
Growers worry about low test weight because local grain buyers often discount their offered price to farmers for low test weight grain. In addition, growers are naturally disappointed when they deliver a 1000-bu semi-load of grain with an average 52-lb test weight because they only get paid for 929 56-lb “market” bushels (52,000 lbs ÷ 56 lbs/bu). On the other hand, high test weight grain makes growers feel good when they deliver a 1000 bushel semi-load of grain with an average 60 lb test weight because they will get paid for 1071 56-lb “market” bushels (60,000 lbs ÷ 56 lbs/bu).
These emotions encourage a belief that high test weight grain is associated with high grain yields (lbs. of dry matter per acre) and vice versa. However, there is little evidence in the research literature that corn test weight has a strong positive relationship with grain yield.
Hybrid variability exists for grain test weight, but also does not necessarily correspond to differences in genetic yield potential. Test weight for a given hybrid can vary from field to field or year to year, but does not necessarily correspond to the yield level of an environment.
Similarly, high yielding fields do not necessarily have higher test weight than lower yield fields. In fact, test weight in grain harvested from severely stressed fields can be amazingly high, as evidenced in Fig. 2 for a number of corn hybrids grown at 3 locations in Kansas in 2011 with widely varying yield levels.
Figure 2. Corn test weight versus grain yield for 27 hybrids grown at 3 Kansas locations (Lingenfelser et.al., 2011). Click on image to view larger version.
Conventional dogma suggests that low test weight corn grain results in lower processor efficiency and quality of processed end-use products like corn starch, though the research literature does not consistently support this belief. Similarly, low test corn grain is often thought to be inferior for animal feed quality, though again the research literature is not in agreement on this. Whether or not low test weight grain is inferior to higher test weight grain may depend on the cause of the low test weight in the first place.
Common Causes of Low Test Weight Corn
Back in the 2009 harvest season in Indiana, there were more reports of low test weight corn grain than good or above average test weights. There were primarily six factors that account for most of the low test weight grain in 2009 and four shared a common overarching effect.
First and foremost, growers should understand that test weight and grain moisture are inversely related. The higher the grain moisture, the lower the test weight. As grain dries in the field or in the dryer, test weight naturally increases as long as kernel integrity remains intact. Test weight increases as grain dries partly because kernel volume tends to shrink with drying and so more kernels pack into a volume bushel and partly because drier grain is slicker which tends to encourage kernels to pack more tightly in a volume bushel. Therefore in a year like 2009 with many of the initial harvest reports of grain moisture ranging from 25 to 30% instead of the usual starting moisture levels of about 20 to 23%, it should not be surprising that test weights were lower than expected. Hellevang (1995) offered a simple formula for estimating the increase in test weight with grain drying. In its simplest form, the equation is (A/B) x C; where A = 100 - dry moisture content, B = 100 - wet moisture content, and C = test weight at wet moisture content. The author does not say, but I suspect this simple formula is most applicable within a “normal” range of harvest moistures; up to moistures in the mid- to high 20’s.
Corn
Example: Dry moisture = 15%, Wet moisture = 25%, Test weight at 25% = 52 lbs/bu.
Test weight at 15% moisture = ((100 - 15) / (100 - 25)) x 52 = (85/75) x 52 = 58.9 lbs/bu
An older reference (Hall & Hill, 1974) offers an alternative suggestion for adjusting test weight for harvest moisture that also accounts for the level of kernel damage in the harvested grain (Table 1). The table values are based on the premise that kernel damage itself lowers test weight to begin with and that further drying of damaged grain results in less of an increase in test weight than what occurs in undamaged grain. Compared to the results from using Hellevang’s simple formula, adjustments to test weight using these tabular values tend to result in smaller adjustments to test weight for high moisture grain at harvest, but larger adjustments for drier grain at harvest.
| Table 1. Adjustment added to the wet-harvest test weight to obtain an expected test weight level after drying to 15.5 percent moisture | ||||||||
| Percent Damage | Grain Moisture at Harvest (Percent) | |||||||
| 30 | 28 | 26 | 24 | 22 | 20 | 18 | 16 | |
| 45 | 0.3 | |||||||
| 40 | 0.7 | 0.2 | ||||||
| 35 | 1.3 | 0.7 | ||||||
| 30 | 1.8 | 1.3 | 0.8 | |||||
| 25 | 2.4 | 1.9 | 1.4 | 0.9 | 0.3 | |||
| 20 | 3.1 | 2.6 | 2.0 | 1.5 | 1.0 | 0.5 | ||
| 15 | 3.8 | 3.2 | 2.7 | 2.2 | 1.7 | 1.2 | 0.6 | 0.2 |
| 10 | 4.5 | 4.0 | 3.5 | 2.9 | 2.2 | 1.9 | 1.4 | 0.8 |
| 5 | 5.3 | 4.7 | 4.2 | 3.7 | 3.0 | 2.7 | 2.1 | 1.6 |
| 0 | 6.1 | 5.6 | 5.0 | 4.5 | 4.0 | 3.5 | 2.9 | 2.4 |
| Sources: Hall & Hill, 1974 | ||||||||
Secondly, thirdly, and fourthly; drought stress, late-season foliar leaf diseases (primarily gray leaf spot and northern corn leaf blight), and below normal temperatures throughout September of 2009 all resulted in a significant deterioration of the crop’s photosynthetic machinery beginning in early to mid-September that “pulled the rug out from beneath” the successful completion of the grain filling period in some fields; resulting in less than optimum starch deposition in the kernels. Fifthly, early October frost/freeze damage to late-developing, immature fields resulted in leaf or whole plant death that effectively put an end to the grain-filling process with the same negative effect on test weight.
Finally, there were widespread reports of ear rots (diplodia, gibberella, etc.) throughout many areas of Indiana in 2009. Kernel damage by these fungal pathogens results in light-weight, chaffy grain that also results in low test weight diseased grain, broken kernels, and excessive levels of foreign material. This cause of low test weight grain obviously results in inferior (if not toxic) animal feed quality grain, unacceptable end-use processing consequences (ethanol yield, DDGS quality, starch yield and quality, etc.), and difficulties in storing the damaged grain without further deterioration.
Related References
Bern, Carl and Thomas Brumm. 2010. Grain Test Weight Deception. Iowa State Extension Publication PMR-1005. [online] <http://www.extension.iastate.edu/Publications/PMR1005.pdf>. [URL accessed Aug 2012].
Bradley, Carl. 2009. Diplodia Ear Rot Causing Problems in Corn Across the State. The Bulletin, Univ of Illinois Extension. [online]. <http://ipm.illinois.edu/bulletin/article.php?id=1233>. [URL accessed Aug 2012].
Hall, Glenn and Lowell Hill. 1974. Test Weight Adjustment Based on Moisture Content and Mechanical Damage of Corn Kernels. Trans. ASAE 17:578-579.
Hellevang, Kenneth. 1995. Grain Moisture Content Effects and Management. North Dakota State Extension Publication AE-905. [online]. <http://www.ag.ndsu.edu/extension-aben/documents/ae905.pdf>. [URL accessed Aug 2012].
Hicks, D.R. and H.A. Cloud. 1991. Calculating Grain Weight Shrinkage in Corn Due to Mechanical Drying. Purdue Extension Publication NCH-61 [online]. <http://www.ces.purdue.edu/extmedia/nch/nch-61.html> [URL accessed Aug 2012].
Hill, Lowell D. 1990. Grain Grades and Standards: Historical Issues Shaping the Future. Univ. of Illinois Press, Champaign, IL.
Hurburgh, Charles and Roger Elmore. 2008. Corn Quality Issues in 2008 - Moisture and Test Weight. Integrated Crop Management News, Iowa State Univ. Extension. [online]. <http://www.extension.iastate.edu/CropNews/2008/1023hurburghrobertsonelmore1.htm>. [URL accessed Aug 2012].
Hurburgh, Charles and Roger Elmore. 2008. Corn Quality Issues in 2008 – Storage Management. Integrated Crop Management News, Iowa State Univ. Extension. [online]. <http://www.extension.iastate.edu/CropNews/2008/1023hurburghrobertson.htm>. [URL accessed Aug 2012].
Lingenfelser, Jane (sr. author). 2011. Kansas Crop Performance Tests with Corn Hybrids. Kansas State University Agricultural Experiment Station and Cooperative Extension Service. [online]. <http://www.ksre.ksu.edu/library/crpsl2/SRP1055.pdf>. [URL accessed Aug 2012].
Nafziger, Emerson. 2003. Test Weight and Yield: A Connection? The Bulletin, Univ of Illinois Extension. [online]. <http://ipm.illinois.edu/bulletin/pastpest/articles/200323h.html>. [URL accessed Aug 2012].
USDA-GIPSA. United States Standards for Corn. 1996. USDA Grain Inspection, Packers and Stockyards Administration (GIPSA). [online] <http://archive.gipsa.usda.gov/reference-library/standards/810corn.pdf>. [URL accessed Aug 2012].
Wise, Kiersten and Charles Woloshuk. 2009. Dealing With Diplodia Ear Rot. Pest & Crop Newsletter, Purdue Extension. [online]. <http://extension.entm.purdue.edu/pestcrop/2009/issue24/index.html>. [URL accessed Aug 2012].
![]()
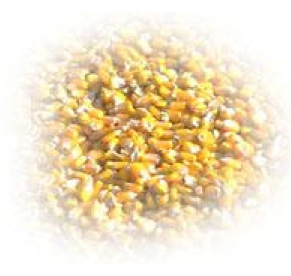
Historical Corn Grain Yields for Indiana and the U.S. – (Bob Nielsen) -
• Yields are steadily increasing over time.
• Year-to-year departures from trend yield are primarily weather-related.
Historical grain yields provide us with a glimpse of yields yet to come, although like the stock markets, past performance is no guarantee of the future. From 1866, the first year USDA began to estimate corn yield, through about 1936, corn yields in the U.S. were fairly constant and averaged about 26 bu/ac throughout that 70-year period. Curiously, the historical data show no appreciable annual change in productivity during that entire time period (Fig. 1).
The adoption of hybrid corn by growers after the Dust Bowl years resulted in the first significant improvement in corn productivity and led to an annual rate of yield improvement of about 0.8 bu/ac/year from about 1937 through about 1955 (Fig. 1). A second significant shift in the annual rate of yield improvement occurred in the mid-1950›s due to a combination of improved genetics, availability of N fertilizer and chemical pesticides, and mechanization (Fig. 1). Since 1955, corn grain yields in the U.S. have increased at a fairly constant 1.9 bushels per acre per year primarily due to sustained improvements in genetics and production technologies (Fig. 1). Some question whether the yield trend line has shifted again in recent years due to the advent of transgenic hybrid technology in the mid-1990’s, but the data show little evidence that a third significant shift in corn productivity has occurred (Fig. 1).
Annual grain yield estimates fluctuate above and below the yield trend line over the years (Fig. 2), primarily in response to weather variability year to year. The Great Drought of 2012 has certainly resulted in dramatic and historic reductions in grain yield relative to trend lines. As of August 2012, the National Ag. Statistics Service of the USDA (USDA-NASS, 2012) estimated that the average U.S. corn grain yield will be 123.4 bu/ac (Fig. 1). This yield estimate would be 23% lower than the predicted 2012 trend yield of 159 bu/ac and would rank as the sixth worst departure from trend yield since the USDA began publishing yield estimates in 1866 (Fig. 2).
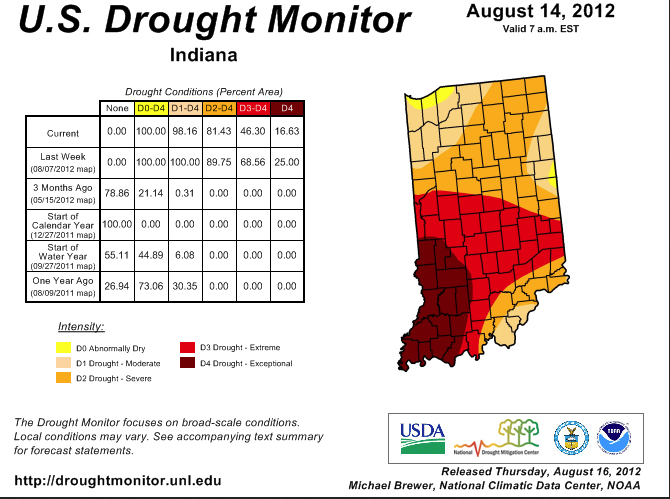
Indiana’s 2012 corn crop is expected to fare worse than the national average, in part because drought conditions developed earlier than the other major Corn Belt states. As of August 2012, the USDA-NASS predicts a statewide corn grain yield of only 100 bu/ac (USDA-NASS, 2012). This yield estimate for Indiana would be 38% below the 2012 trend yield estimate of 162 bu/ac and would constitute the single worst departure from trend yield since the USDA began publishing yield estimates in 1866 (Fig. 3).

Figure 1
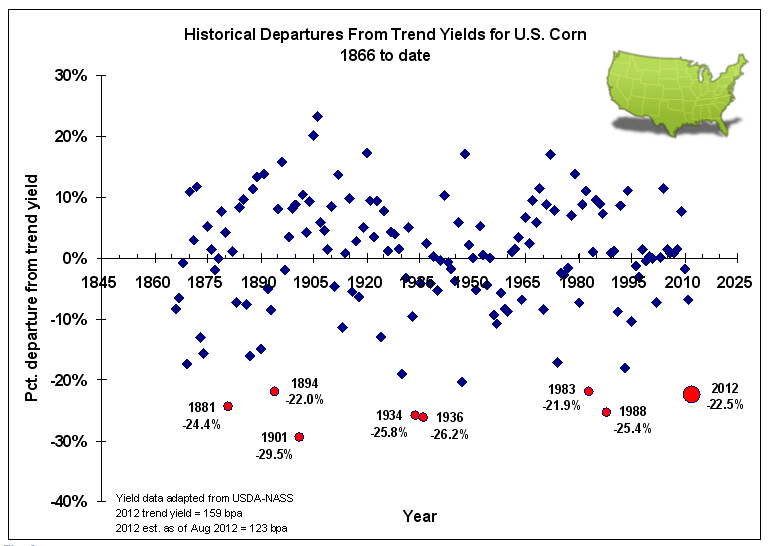
Figure 2
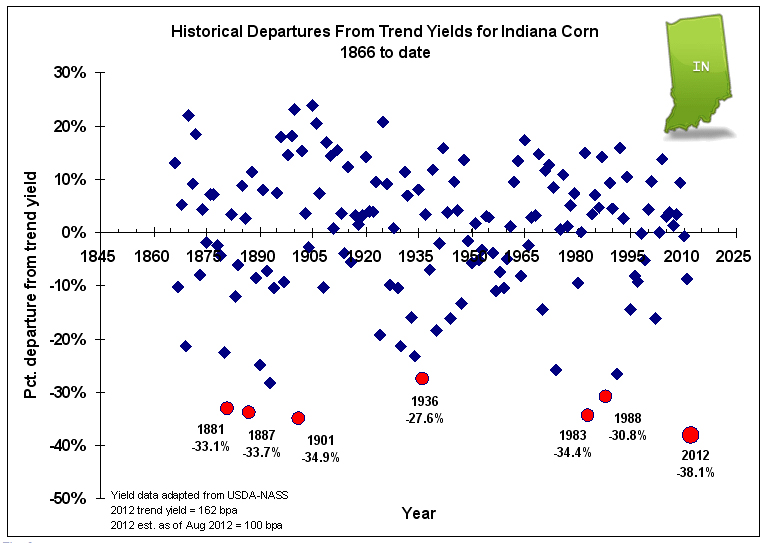
Figure 3
References
USDA-NASS. 2012. Crop Production. United States Dept. of Agr - Nat’l Ag. Statistics Service, Washington, D.C. Online at <http://usda.mannlib.cornell.edu/MannUsda/viewDocumentInfo.do?documentID=1046>. [URL accessed Aug 2012].
![]()

![]()