
- Black Cutworm Finding Hoosier Hospitality
- Accumulated Heat Units for Alfalfa Weevil
- Black Light Trap Catch Report
- Black Cutworm Adult Pheromone Trap Report
- Ridomil Gold SL Approved for Use in Tobacco Transplant Water in Indiana
- Monitor the Risk of Fusarium Head Blight (Scab) in Indiana Wheat
- Tillage Consideration for Delayed Planting of Corn in a Wet Spring
- "Safe Hybrid Maturities for Delayed Corn Planting in Indiana
- Thoughts on Seeding Rates for Corn
Black Cutworm Finding Hoosier Hospitality - (Christian Krupke and John Obermeyer)
• Black cutworm moth arrival has never been higher.
• Moths are seeking weedy fields to lay their eggs, plenty to choose from.
• Seed insecticides and traited-corn may be little help if cool, wet conditions persist after planting
Look at this week’s “Black Cutworm Adult Pheromone Trap Report.” Our dutiful cooperators have captured an inordinate number of moths these last couple weeks. As of April 15, we’ve begun tracking heat unit accumulations to predict future cutting by this pest, developmental map published in future issues of the Pest&Crop.
The key question is: will egg-laden black cutworm moths arriving in our fair Hoosier state find your fields attractive to lay eggs in? There are some clues that help give us an answer: Barren fields are not appealing. Moths are particularly attracted to winter annuals, such as chickweed and mustards. But the black cutworm has a broad host range, and fields that are showing plenty of green, yellow, and purple (henbit) are at highest risk for cutworm damage. Remember, corn is one of the black cutworms least favorite foods, it just so happens it is the only plant remaining by the time larvae have emerged and weeds have been killed. Cutworm larvae starve if weeds are treated with tillage or herbicide 2-3 weeks before corn emergence. It is obviously too late for that this year.
We don’t want producers to have a false sense of security with seed-applied insecticides and some varieties of Bt-traited corn, where the label provides only “suppression” and not “control”. Check the fine print on the trait you are using! Suppression is fine under ideal environmental conditions and moderate infestation levels. The systemic activity of the seed-applied insecticide, and/or the protein production of the Bt-corn are optimal when the corn seedling is actively growing. However, under environmental stress (i.e., yellow corn, cold and wet soil) the efficacy of these control products are greatly reduced, leaving the struggling seedling vulnerable to attack by above and below ground insect pests. We will continue to update in coming weeks and include scouting and treatment guidelines in future articles. For now, we will wait and see – with only 2-5% of the corn planted in the state, it will be some time before we see damage.
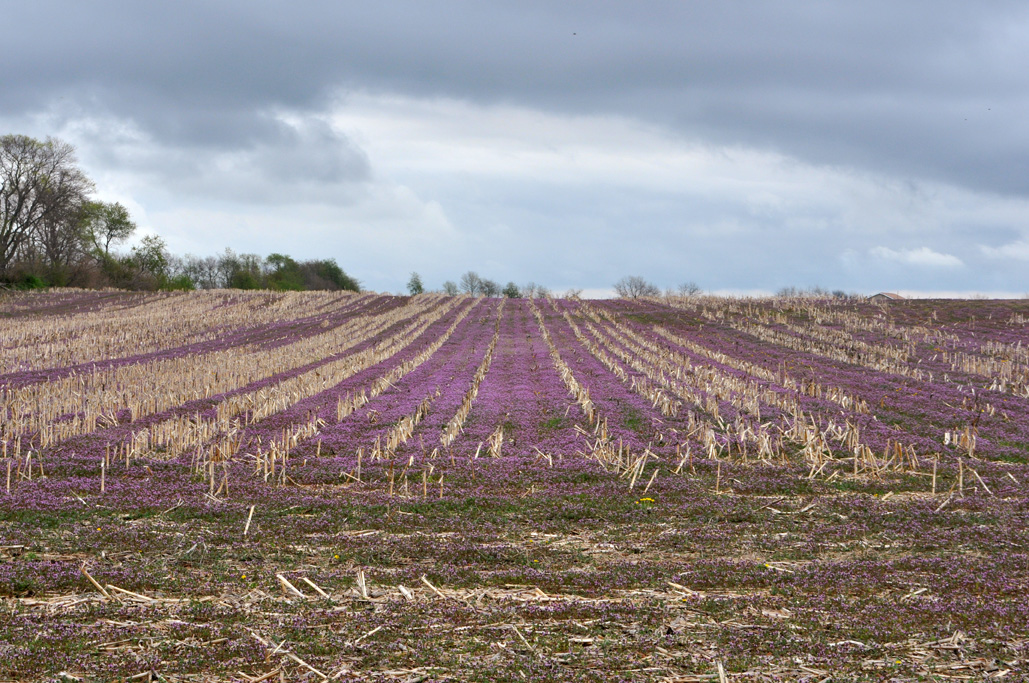
City folks think these fields are pretty...so do black cutworm!

Black cutworm eggs compared to penny's Lincoln head
![]()
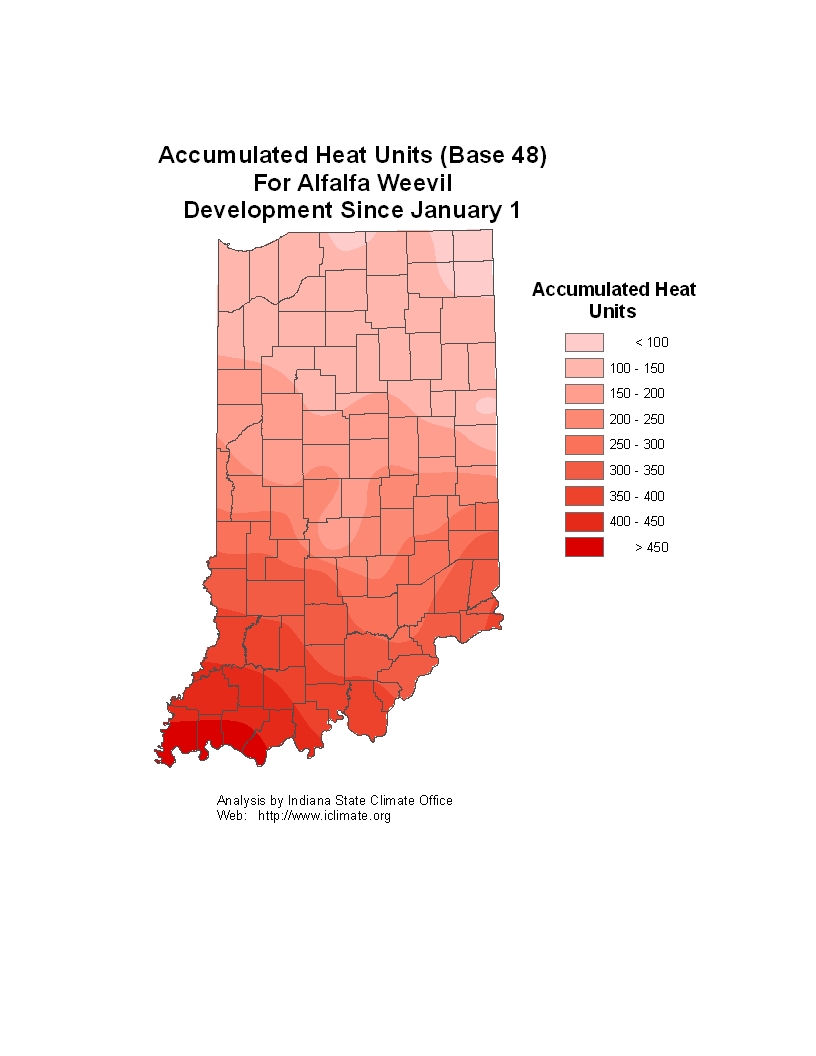
Hey central and southern Indiana, don't forget alfalfa weevil scouting!
![]()
Click here to see the Black Light Trap Catch Report
![]()
Click here to see the Black Cutworm Adult Pheromone Trap Report
Poison Hemlock Control in Corn and Soybean - (Glenn Nice)
Although Poison hemlock has been troublesome in pastures and rangeland for quite some time, it has typically sat beyond the borders of corn and soybean fields, being content to watch from railway tracks and the ditch. This may no longer be the case. The adoption of no-till has promoted a weed shift favoring some of the perennials and biennials. Bill and I receive calls regarding control of hemlock in row crops, particularly in soybean. Most often growers and applicators were concerned that glyphosate alone just prior to planting or as the 1st postemergence spray did not provide adequate control. We noticed that poison hemlock is actively growing in ditch banks and along field edges. So the purpose of this article is to provide some guidance on how to manage this weed.
Poison hemlock is a biennial, meaning that it takes two years for it to complete its life cycle. The first year it exists as a low lying rosette (Figure 1.), then it will bolt after over wintering and be three to eight feet tall at maturity. Poison hemlock flowers in June or July and once seed is produced generally dies late July and August. We generally receive calls regarding the control of poison hemlock when it has reached maturity and is flowering out. Biennials are often more susceptible to chemical control in the first year of growth when they are rosettes.
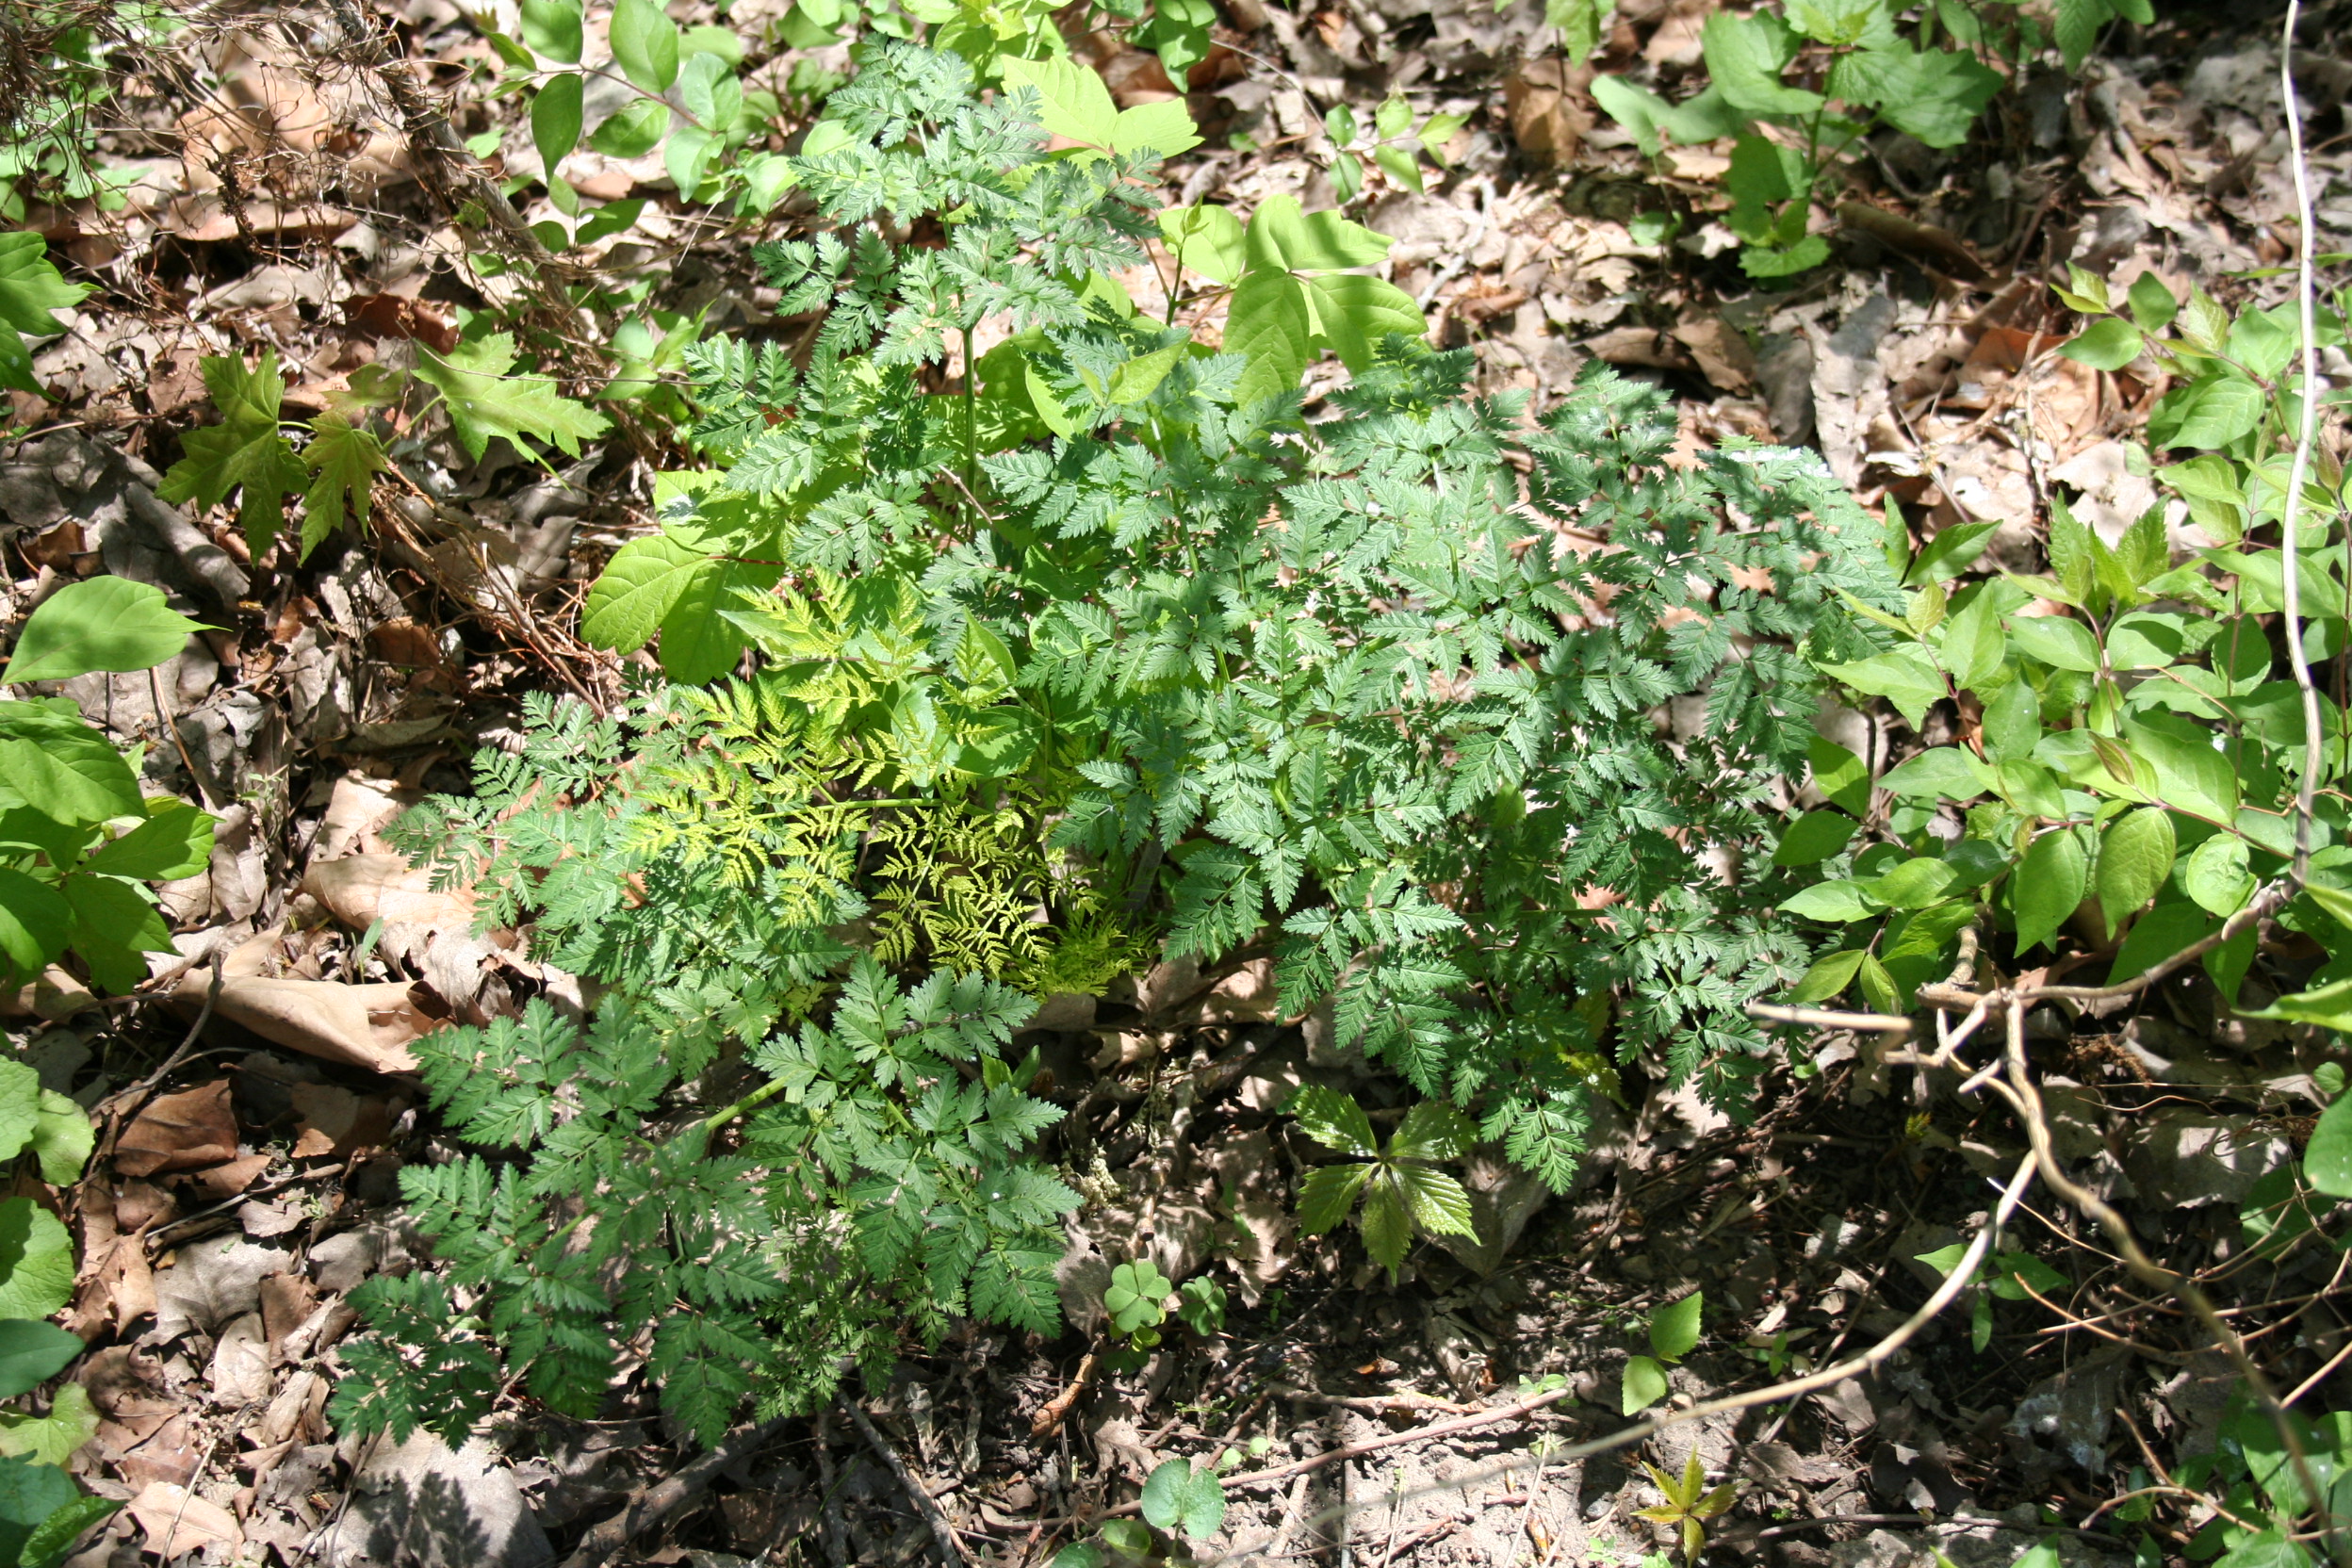
Poison hemlock rosettes in the spring
Control
Poison hemlock historically has not been a problem in corn and soybean. Because of this there is not a large body of research done on poison hemlock’s control in corn and soybean. If you have poison hemlock in your no-till field it is a good idea to add either dicamba or 2,4-D in your burndowns and to target poison hemlock in the first years growth, while it is still a rosette. Below are some of the options available to suppress or control poison hemlock in corn and soybean situations.
Corn and Soybean
Burndown applications of glyphosate plus 2,4-D (1 lb ai/A) in the fall can control rosettes in the fall or in the early spring. Applications of 2,4-D of rates higher than 0.5 lb ai/A require a 30 days waiting period before planting soybean and 7 to 14 days before planting corn (see specific label for details). Glyphosate labels recommend applications from bud to flower.
Glyphosate can also be used POST in RR soybean and corn.
Corn
Burndown or PRE applications of Basis (0.5 oz/A) plus 2,4-D LVE (1 pt/A) or Basis (0.3 to 0.5 oz/A) plus 2,4-D (1 pt/A) plus atrazine at 0.5 to 1 lb ai/A. There is a 7 to 14 day planting restriction when using 2,4-D to planting corn, see specific product label for details. Basis will provide some residual control of germinating poison hemlock.
Burndown or POST applications of dicamba (0.5 pt/A) or 2,4-D can suppress to control poison hemlock. Dicamba provides good control where 2,4-D can provide fair control. Dicamba can be applied before planting and postemergence from spike to 36 inch tall corn or until 15 days before tassel emergence. Risks of injury increases after corn is eight inches tall, the use of drop nozzles are suggested. Drop nozzles should be used when applying 2,4-D (0.17 to 0.25 lb ai/A) after the corn is eight inches tall for added safety.
Soybean
Burndown applications of glyphosate (1 lb ae/A) plus 2,4-D (1 lb ai/A) ether in the fall or early spring on rosettes of can provide good control of poison hemlock. There is a 7 day waiting period after 2,4-D applications of 0.5 lb ai/A or less, but a 30 day waiting period with applications above 0.5 lb ai/A to plant soybean. Glyphosate can be used POST in RR soybean.
![]()
Cold Wet Weather and Postemergence, Spike Stage Herbicide Applications in Corn (Bill Johnson, Glenn Nice, Purdue University, and Mark Loux, The Ohio State University)
Even though a lot of corn was planted in mid-April, it is likely that recent rainy conditions prohibited many fields from receiving soil applied herbicides. Since almost all soil applied chloroacetamide/atrazine premix products can be applied to emerged corn, it will be tempting to spray these fields as soon as they are dry enough to drive across. Here are a few important points to keep in mind.
- Cool, cloudy weather and wet soils slow the corn plants ability to metabolize (detoxify) herbicides. Corn will be stressed after coming through the cool, wet period and will be more susceptible to showing herbicide injury symptoms. This is a typical condition under which we see atrazine injury and chloroacetamide injury.
- As a general rule, do not apply chloroacetamide:atrazine premixes in nitrogen solutions if the corn is emerged. Nitrogen solutions are effective in promoting herbicide uptake and causing necrosis on leaves by themselves, resulting in severe injury. Most labels state that atrazine premixes should only be applied in water if the corn has emerged. A few products do allow postemergence applications in nitrogen solutions, but consult the label if you have questions about a specific product.
- Another general consideration involves tank mixtures of 2,4-D with a chloroacetamide:atrazine premix and applying this mixture to emerged corn. The acetochlor (Harness, Degree, TopNotch, Surpass, Confidence and Volley) labels indicate that 2,4-D should not be applied within 7-14 days before or 3-5 days after planting, but before crop emergence. This restriction is written into to the label because of crop injury concerns. Applications within 7-14 days before planting can injure corn by being washed down into the corn seed germination zone (seed furrow). Applications after corn planting can cause injury if the combination of products comes into contact with corn foliage. If in doubt about crop injury potential of a specific chloroacetamide:atrazine premix, consult the label to see if it is allowed or do not tankmix 2,4-D with atrazine premixes and apply to emerged corn.
- If the field has a dense infestation of emerged weeds and an aggressive adjuvant system will be needed to increase postemergence herbicide activity, wait a few days to allow the corn to recover from the cold stress before applying herbicides.
- Treatments that contain atrazine will control many small, emerged broadleaf weeds. Among preemergence herbicides, Lexar/Lumax and mixtures of SureStart plus atrazine provide the broadest spectrum of broadleaf weed control, especially as weeds get larger. Emerged grass weeds tend to be more of an issue. Atrazine has activity on emerged grasses, and it is most effective when applied at high rates to very small (less than one inch) grasses. Products which contain rimsulfuron (Resolve) will provide some foliar and residual control of grass weeds and Resolve can be mixed with either the atrazine premixes or with glyphosate or glufosinate in Roundup Ready or Liberty Link corn, respectively. Larger grasses will require the addition of postemergence herbicides such as Option, Equip, Steadfast, Accent, glyphosate (Roundup Ready corn) or glufosinate (Liberty Link corn). Impact and Laudis also have some activity on emerged grasses and they also control many broadleaf weeds. However, we feel that they would fit best in situations were grass densities are low since they are not quite as effective as the previously mentioned grass herbicides. Impact and Laudis should be mixed with atrazine for most effective control.
There are several corn products that have both some burndown capability and can be applied post early. For a list of products and rates see table below.
| Table 1. Corn residual products that can be applied to young emerged corn | |||
| Herbicide | Timing on Corn | Rate Range[1] | Comment |
| Harness, TopNotch, Surpass, Degree, Confidence and Volley [acetochlor] | Up to 11 inches | Degree (3.8L) - 1.25 to 2.75 pts/A Surpass, Volley (6.4EC) - 2 to 3 pts/A | Except for Degree, the other products must be applied in water after emergence. Will require tank-mix partner (glyphosate in RR corn or Ignite in LL corn or atrazine) for burndown activity. Will have preemergence activity on annual grasses, nightshade and pigweeds. |
| Harness Xtra, Degree Xtra, Fultime, Keystone, Confidence Xtra and Volley ATZ [acetochlor + atrazine] | Up to 11 inches or 5 to 6-leaf | Degree Xtra (4L) - 2.9 to 3.7 qts/A Fultime (4L) - 2.25 to 5 qts/A Harness Xtra, Confidence Xtra (5.6L) - 1.4 to 2.75 qts/Keystone, Volley ATZ (5.25L) - 2.2 to 3.4 qts/A | Degree Xtra and Fultime can provide slightly longer residual control. Can provide some burndown control of small weeds (2-leaf). Except for Degree Xtra use water as the carrier for postemergence treatments. Tank mixing a burndown product is recommended. Balance Flexx can improve control of some weeds. |
| Micro-Tech, Lasso and others [alachlor] | Up to 5 inches | Lasso (4EC) - 2 to 3.25 qts/A | Will have some control of seedling weeds that are 2-leaf or smaller. Do not apply in fertilizer when air temperature exceeds 85 degrees. |
| Lariat or Bullet [alachlor + atrazine] | Up to 5 inches | Lariat, Bullet - 2.5 to 4.5 qts/A | Apply Lariat in water only and Bullet can be applied water or 28% if temperatures are below 85 degrees. |
| Balance Flexx [isoxaflutole + cyprosulfamide (Safener)] | Up to 2-leaf | 3 to 6 fl oz/A | Do not tank mix with adjuvants or herbicides other than atrazone on emerged corn. Can control very small weeds (1-leaf). |
| Callisto [mesotrione] | Early postemergence to 30 inches or 8-leaf | 3 fl oz/A | Has burndown activity on broadleaves, but little residual activity on the postemergence rate. |
| Corvus [isoxaflutole + cyprosulfamide + thiencarbazone-methy] | Up to 2-leaf | 3.33 to 5.6 oz/A | Will control small emerged weeds. Mixing with atrazine will increase control. Do not apply with adjuvants on emerged corn. |
| Guardsman Max [dimethenamid-P + atrazine] | Up to 12 inches | 2.5 to 4.6 pts/A | Do not use liquid fertilizer as the spray carrier. Can be applied with surfactant or low rates of liquid nitrogen. COC may be included. |
| Lexar [s-metolachlor + mesotrione + atrazine] | Up to 12 inches | 3 to 3.5 qts/A | Do not apply with other bleachers in this class of herbicides. See label for insecticide interactions. Do not use with liquid fertilizer. |
| Bicep II Magnum, Cinch ATZ and Stalwart [metolachlor or s-metolachlor + atrazine] | Up to 5 inches | 1.3 to 2.58 qts/A | Will control small weeds (2-leaf). |
| [1]Most product rate ranges are dependent on soil texture and percent organic matter. | |||
![]()
Ridomil Gold SL Approved for Use in Tobacco Transplant Water in Indiana – (Kiersten Wise)
Indiana tobacco producers have been granted a special local needs label, known as a 24(c) label, to control the disease black shank (Phytophthora nicotianae) in tobacco transplant water. The fungicide Ridomil Gold SL (mefanoxam; Syngenta Crop Protection) is a water-soluble formulation that can be applied at a rate of 4 to 8 fl oz/A, in 200 gal/A of transplant water. To avoid seedling injury, do not apply the product in less than 200 gallons of water/A, and do not apply to stressed seedlings, or during hot and dry conditions. Ridomil Gold SL is a different formulation than Ridomil Gold EC and Ridomil Gold 2EC. These formulations, or generic versions of mefanoxam, may injure tobacco seedlings if applied in water. This application does count toward the 1.5 lb a.i./A, or 3 pts/A, limit of mefanoxam products that can be applied to tobacco in a single season. Producers must have a copy of the Indiana 24(c) special local needs label in their possession at the time of the fungicide application. For more information on managing black shank of tobacco, please refer to the newsletter article written by Kenny Seebold of the University of Kentucky: <http://www.ca.uky.edu/agcollege/plantpathology/extension/KPN%20Site%20Files/
kpn_11/pn_110329.html>.
![]()
Monitor the Risk of Fusarium Head Blight (Scab) in Indiana Wheat – (Kiersten Wise)
• Monitor the wheat scab risk map during head emergence and flowering: <http://www.wheatscab.psu.edu/>
• Sign up for updates on risk of scab at <http://scabusa.org/fhb_alert.php>.
Wheat is approaching head emergence (Feekes 10.5) in far southern Indiana, and is in early boot (Feekes 10) in southern Indiana. Wheat in northern Indiana is further behind, and in some areas is just now jointing (Feekes 6). As wheat approaches flowering (Feekes 10.5.1, Figure 1), in southern Indiana, it is important to consider the risk for Fusarium head blight, or scab, development.
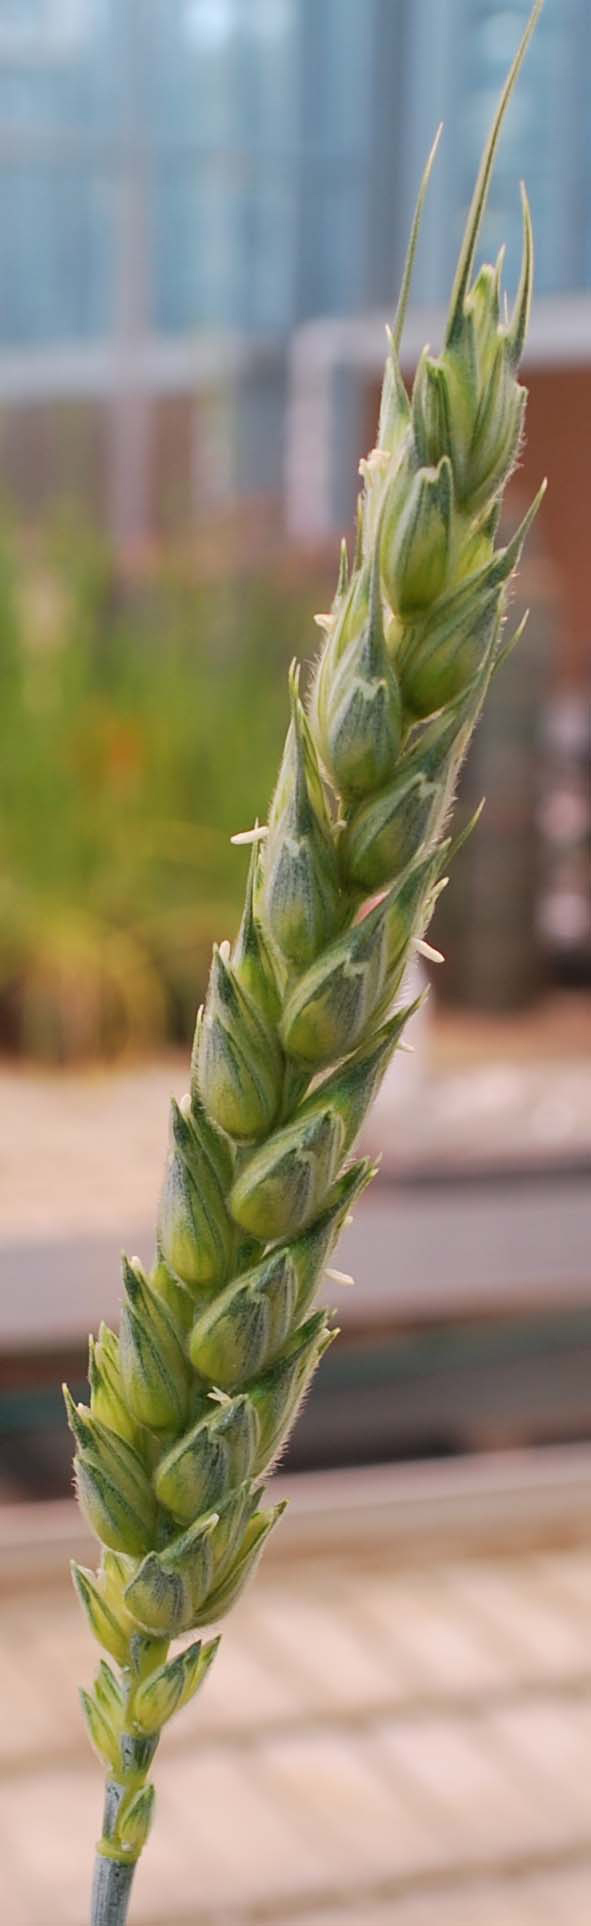
Figure 1. Feekes 10.5.1, or beginning flowering
The fungus that causes head scab, Fusarium graminearium, infects wheat during flowering, beginning at Feekes 10.5.1. Symptoms include bleached spikelets on the head (Figure 2), and small or shriveled grain kernels, commonly called “tombstones.” The fungus also produces mycotoxins, such as deoxynivalenol, or DON, which can accumulate in the infected grain.
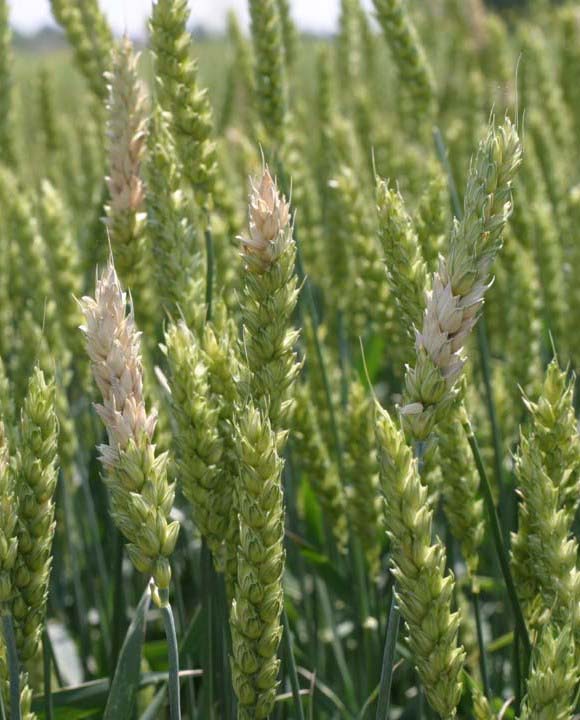
Figure 2. The bleached spiklets present on the wheat head is disgnostic of Fusarium head blight
Rainy, warm, and humid weather conditions favor disease development. The recent rains may have triggered spore production, and if the wet, humid weather continues as the majority of wheat in southern IN begins to flower, it is possible that a fungicide application will be necessary to suppress Fusarium head blight.
Now is a good time to become familiar with the risk assessment tool available to assess the risk of Fusarium head blight in Indiana. This model can be accessed through the following link: <http://www.wheatscab.psu.edu/>.
At this site there are several links that explain how the model was developed, and links providing additional information about Fusarium head blight on wheat. To access the model, click on the link marked “Risk Map Tool.” The first screen will explain how to use the model. This model requires that you know the approximate flowering date of your wheat variety, and after reading the initial screen, click on calendar to input the date that your variety is expected to flower. Next, click on the state map of Indiana. Commentary on Indiana wheat development and disease risk will be displayed on this screen, as well as Indiana weather stations. Clicking on a weather station within the state will generate a prediction for the risk of Fusarium head blight development in that area (Figure 3).
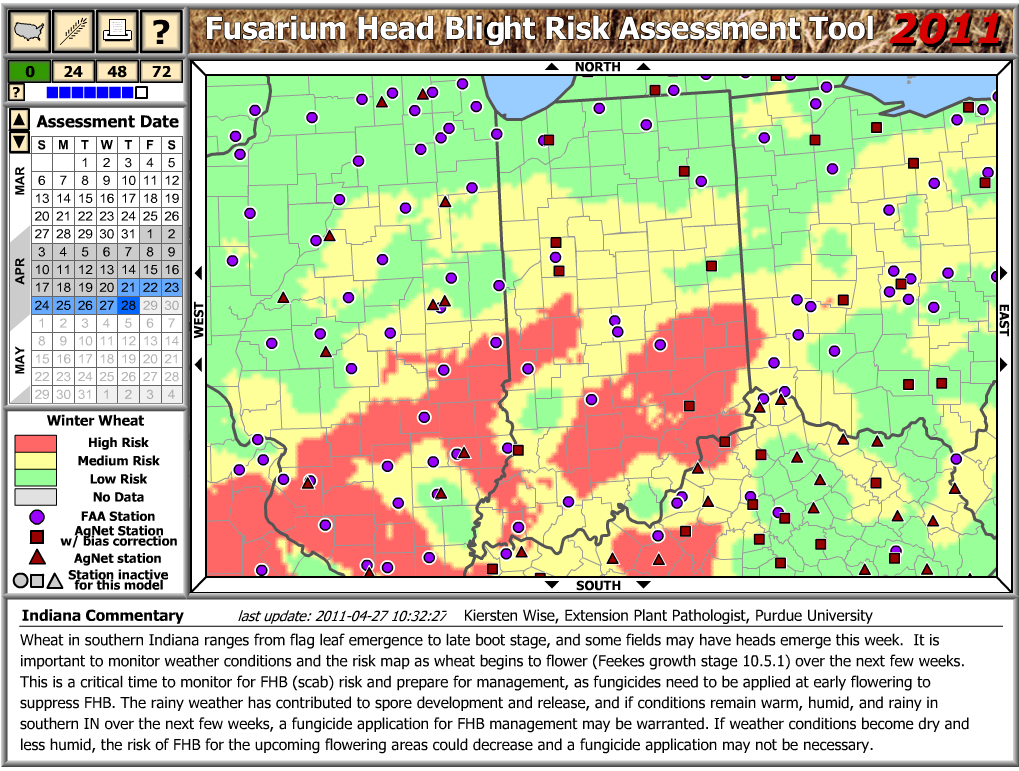
Figure 3. Indiana commentary and rist of fusarium head blight development on the wheat scab risk model: <http://www.wheatscab.psu.edu/>
This model uses weather information including temperature, rainfall, and relative humidity to calculate risk levels for Fusarium head blight. Although it is a good tool for predicting risk, it has an estimated accuracy level of 80%. Keep in mind that the model does not provide a guaranteed prediction for whether or not scab will occur in individual fields, and additional factors such as the local weather forecast, crop conditions, and Extension commentary should be considered when assessing the level of risk. Producers can sign up for alerts, courtesy of the U.S. Wheat and Barley Scab Initative. Alerts can be sent to a cell phone or email, and will be sent out as the risk map updates risk of scab in Indiana. To sign up for alerts, visit: <http://scabusa.org/fhb_alert.php>.
Crop rotation and selection of partially resistant varieties can help reduce the impact of Fusarium head blight development, but timely fungicide applications may be needed to suppress the disease in-season. There are several fungicides available for Fusarium head blight control, and these are listed in the foliar fungicide efficacy table developed by the North Central Regional Committee on Management of Small Grain Diseases or NCERA-184 committee: <http://www.ppdl.purdue.edu/ppdl/wise/NCERA_184_Wheat_fungicide_chart_2010_v2.pdf>. Applications of fungicide prior to head emergence, such as those applied at jointing or flag leaf emergence may not reduce FHB infection. Be sure to follow label restrictions on how many days must pass between fungicide application and harvest.
![]()
Tillage Considerations for Delayed Planting of Corn in a Wet Spring (Tony J. Vyn)
Introduction:
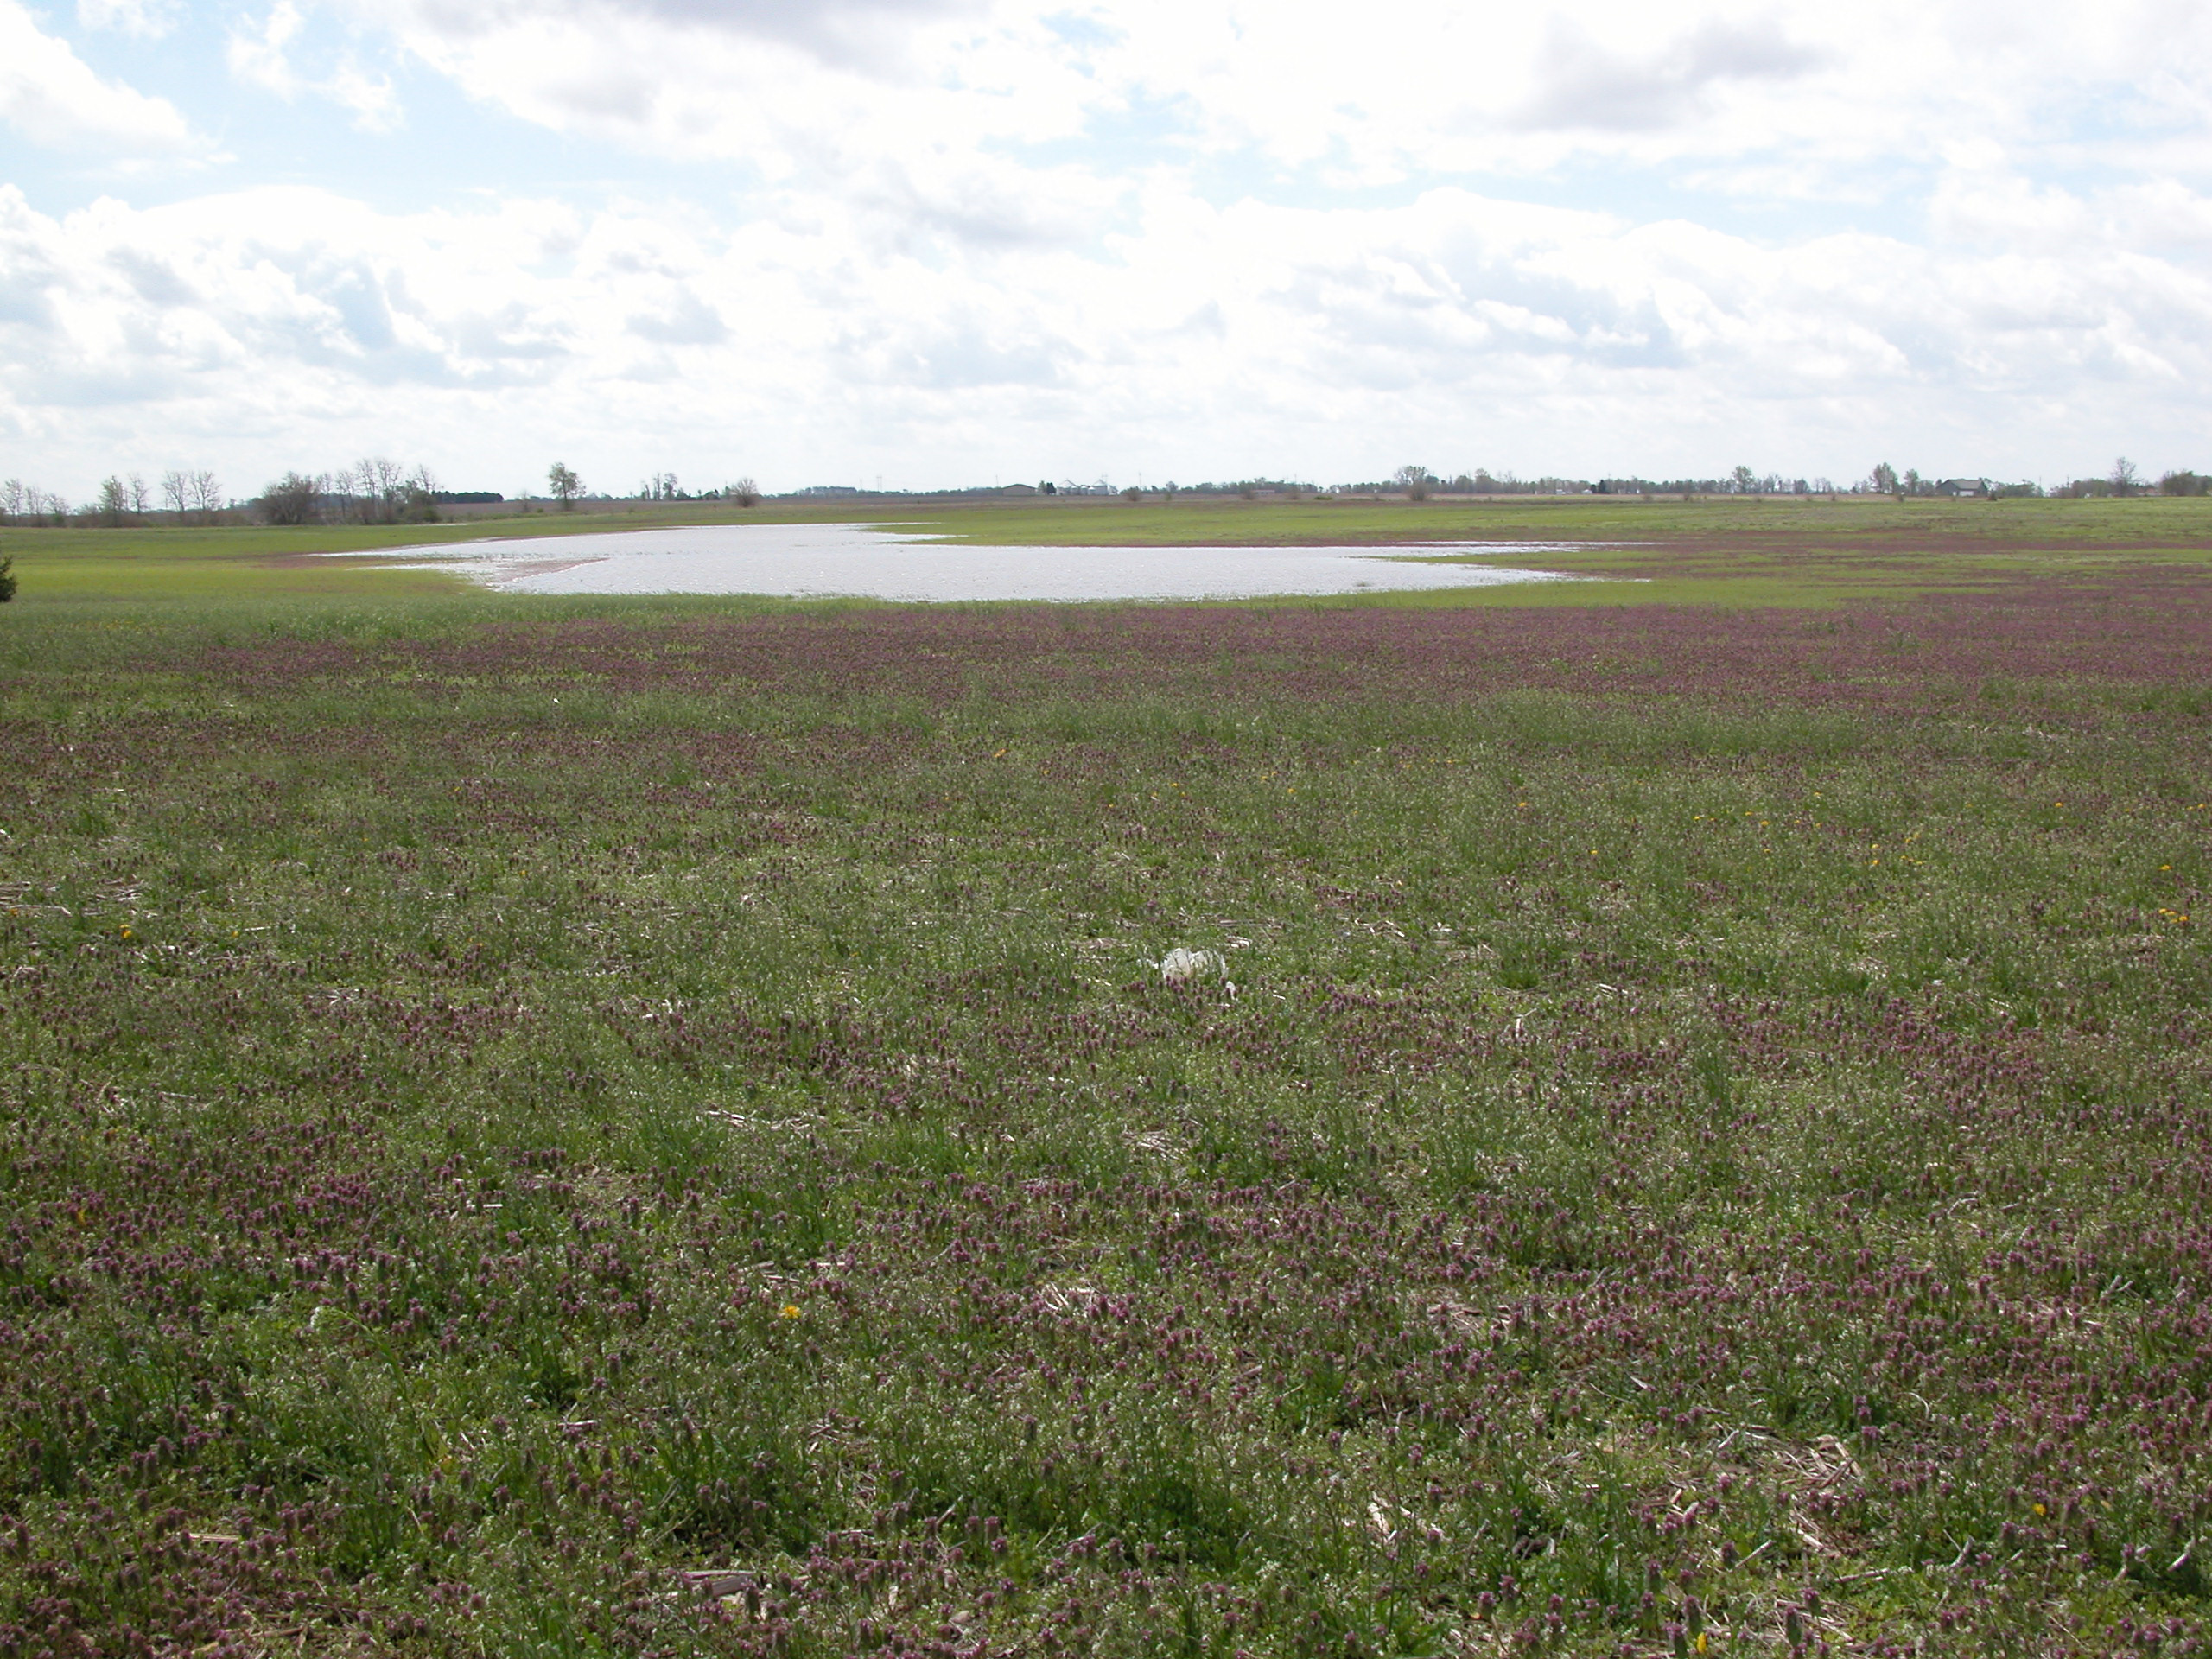
Just 2% of corn was planted in Indiana as of April 24, 2011 (USDA-NASS). Most other large-acreage corn states were in the same situation, and nationally only 9% of the intended corn crop has been seeded. Heavy rains over the Easter weekend and since have virtually assured that Indiana corn planting is going to be delayed until May 2 at the earliest. When soil conditions do finally become dry enough to support tractors and other field equipment, Indiana farmers will face possibly different tillage and planting choices than they would have faced as recently as last spring (April, 2010) when they had the luxury of a prolonged period of warm and dry weather conditions. The combination of record corn prices and planting delays understandably fuels farmer anxiety, but it also enhances the financial implications of management choices made in the crop establishment period. So the major question this season is How should my intended tillage program change in response to the current realities of saturated soils (if not outright ponds) within fields, the weather forecast, and the calendar? The following guidelines may be helpful to the decision making process.
Tillage Considerations and Associated Recommendations:
- Maintaining tillage options in specific fields depends on achieving satisfactory weed control. As air temperatures gradually warm, each day brings with it more weed growth on fields that did not receive recent applications of residual herbicides. Effective no-till and modified no-till planting systems (e.g., such as those with shallow vertical tillage) rely on effective weed management via herbicides so that surface soil evaporation can be speeded up when the rain stops, so that corn seed placement is not compromised while planting, and so that early weed competition with corn seedlings doesnt subtract from corn yield potential. Generally herbicide sprayers can, and in many cases should, precede tillage and planting operations that arent going to receive intensive, full-width tillage this spring.

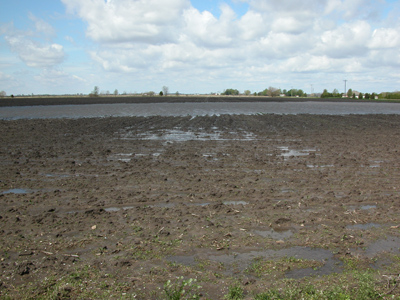
Weed growth challenge and ponded water challenge.
- Surface roughness left after fall tillage operations in 2010 (or any spring tillage operations in late March or early April of 2011) constrains tillage options in May. The dry conditions in the fall of 2010 encouraged more extensive, as well as deeper, fall primary tillage operations than are normally achieved in Indiana. Although some of the initial soil roughness will have dissipated with freeze-thaw and wetting/drying cycles since the last tillage operation, rougher soil surfaces will require deeper and more intensive secondary tillage before planting. Effectively, soil conditions need to be fit down to and at least a full inch below the intended tillage depth before secondary tillage is advised. So farmers will need to be more patient in delaying secondary tillage operations if they have fields with rough soil surfaces.
Wet and rough fields which will need secondary tillage for leveling purposes once the surface soil dries.
- Stale seedbed planting often reduces seedbed compaction damage and enables earlier planting. Although stale seedbed planting is at the core of strip-till systems, rain-delayed planting following full-width tillage operations is less frequent. In situations where the soil surface is smooth enough to permit planting corn seed at uniform depths, and where timely weed control can be achieved, stale seedbed planting should be considered. Soils with high clay content, slow drying capability (perhaps compounded by inadequate sub-surface drainage), and low aggregate structural stability are often ideal soils for stale seedbed planting. Those same soils are also those at most risk of excessive clods and uneven seedbed moisture conditions if secondary tillage is imposed too early. The stale seedbed system permits earlier planting because planting can start as soon as the surface soil dries out and seed furrow opening can occur with minimal side-wall compaction in the row zone. It is unfortunate that inadequate funding has constrained research on various stale seedbed planting options (e.g., following deep ripping alone, disking, chisel plowing or fall vertical tillage) to verify the relative corn yield benefits of this system. Nevertheless, preliminary and unpublished results from my program have suggested corn yields can be equal with planting on stale seedbeds versus that following recent secondary tillage. If equal corn yields can be achieved when for stale seedbed and traditional secondary tillage when the planting date is similar, then there is even more opportunity for corn yield gains with stale seedbed planting if the planting date can be advanced.
- A single, shallow, and well-timed tillage operation is preferred if pre-plant tillage is deemed necessary. It is crucial that secondary tillage depth be limited to the minimum necessary for successful corn planting because soil compaction risk and dry-clod risk increase when spring tillage is at deeper depths. There is no inherent benefit to corn production from doing secondary tillage any deeper than 3 inches. Similarly, there is very little likelihood of any yield advantage accruing from a second or third secondary tillage pass; if anything further delaying corn planting will limit yield potential more than what can be gained by multiple secondary tillage passes. As long as the first tillage operation following weeks of rain delays is done at a soil moisture condition when tillage can make a suitable seedbed, and when emerged weeds can be killed, no further secondary tillage operations should be required.
- No-till corn planting remains a viable option. Certainly if corn will follow soybean in rotation, and the soybean stubble has been undisturbed since harvest, no-till corn planting into optimum soil conditions may be the preferred option. The probability of successful yields with no-till does not decline with later planting dates; if anything, the relative yield potential of no-till corn increases versus corn yields likely to be achieved after more intensive tillage operations. Nevertheless, successful no-till planting presumes the corn farmer has a capable planter, a sound management strategy (e.g., for nutrients and pest control), adequate sub-surface drainage, and sufficiently dry soils (e.g. no side-wall smearing) during the planting operation itself.
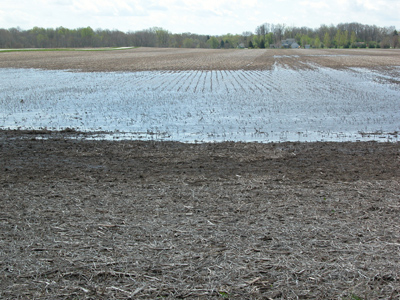
Wet and smooth fields that would be a good candidate for possible no-till or stale seedbed planting.
- Vertical tillage systems may be able to speed surface soil drying. Typically shallow and high-speed vertical tillage operations may help to speed up the rate of surface soil drying when there is non-uniform residue cover or rain-matted residue cover. These tools, although growing in popularity in the Eastern Cornbelt for at least a decade, have not received sufficient research attention because of funding constraints. The limited corn yield results with such systems in trials conducted by Purdue University to date have been inconsistent. In some cases yields have been substantially superior to no-till corn, but in other cases equal to those with no-till. There are risks associated with vertical tillage; these include the risk of soil compaction associated with tractor tires (or tracks) or the coulters themselves (even when operated at 1 or 2 depths) if the soil conditions are not fit for tillage. However, vertical tillage can help make the surface soil moisture contents more uniform across sloping fields at the time of planting, and that may help to advance the planting date compared to a completely undisturbed no-till planting system (especially in fields with non-uniform drainage, and in high residue situations).
- Spring strip-tillage operations should also be shallow. Fall strip tillage (done properly) will generally offer earlier corn planting opportunities than that which is likely following spring strip-till or undisturbed no-till. Yet, if farmers can wait until soil conditions are fit down to a 4-inch or 5-inch depth, and have the equipment options to do shallow strip-till in spring, there can be corn yield advantages associated with doing so. In contrast with fall strip-till, with spring strip-till there is less need to achieved a raised berm in the intended corn rows, but a greater need to use rolling baskets or other firming devices to retain soil moisture at seeding depths. Spring strip-till depths should be no deeper than 5 inches, should be timed so that corn planting follows spring strip-tilling before excessive seedbed moisture loss occurs, and should not involve applications of excessive rates of banded nitrogen (N) and potassium (K2O) fertilizers. High rates of recently applied N and K fertilizers in the strip-tilled zone will compromise corn seedling establishment (especially when dry conditions prevail following corn planting).
- Precise automatic guidance tools provide new opportunities to limit soil compaction in the actual corn rows. Although there is an inherent risk from soil compaction by the tillage tool itself, there can be even bigger risks associated with wheel track compaction. Adjustments like reduced tire inflation pressures can help, but an even more important factor can be the use of controlled traffic systems in any pre-planting tillage and fertilizer applications. Use of the RTK (real time kinematic) steering systems enable corn farmers with such systems to precisely control where the wheel tracks will occur prior to planting. Even though diagonal secondary tillage operations are sometimes preferred for helping achieve additional soil leveling, this spring it might be more essential to practice any required tillage precisely parallel to the intended corn rows, and using the same wheel tracks as that intended for the planting tractor. Higher soil moisture contents at depth than that experienced in more typical springs potentially mean greater yield benefits from limiting soil compaction (especially that directly under the rows).


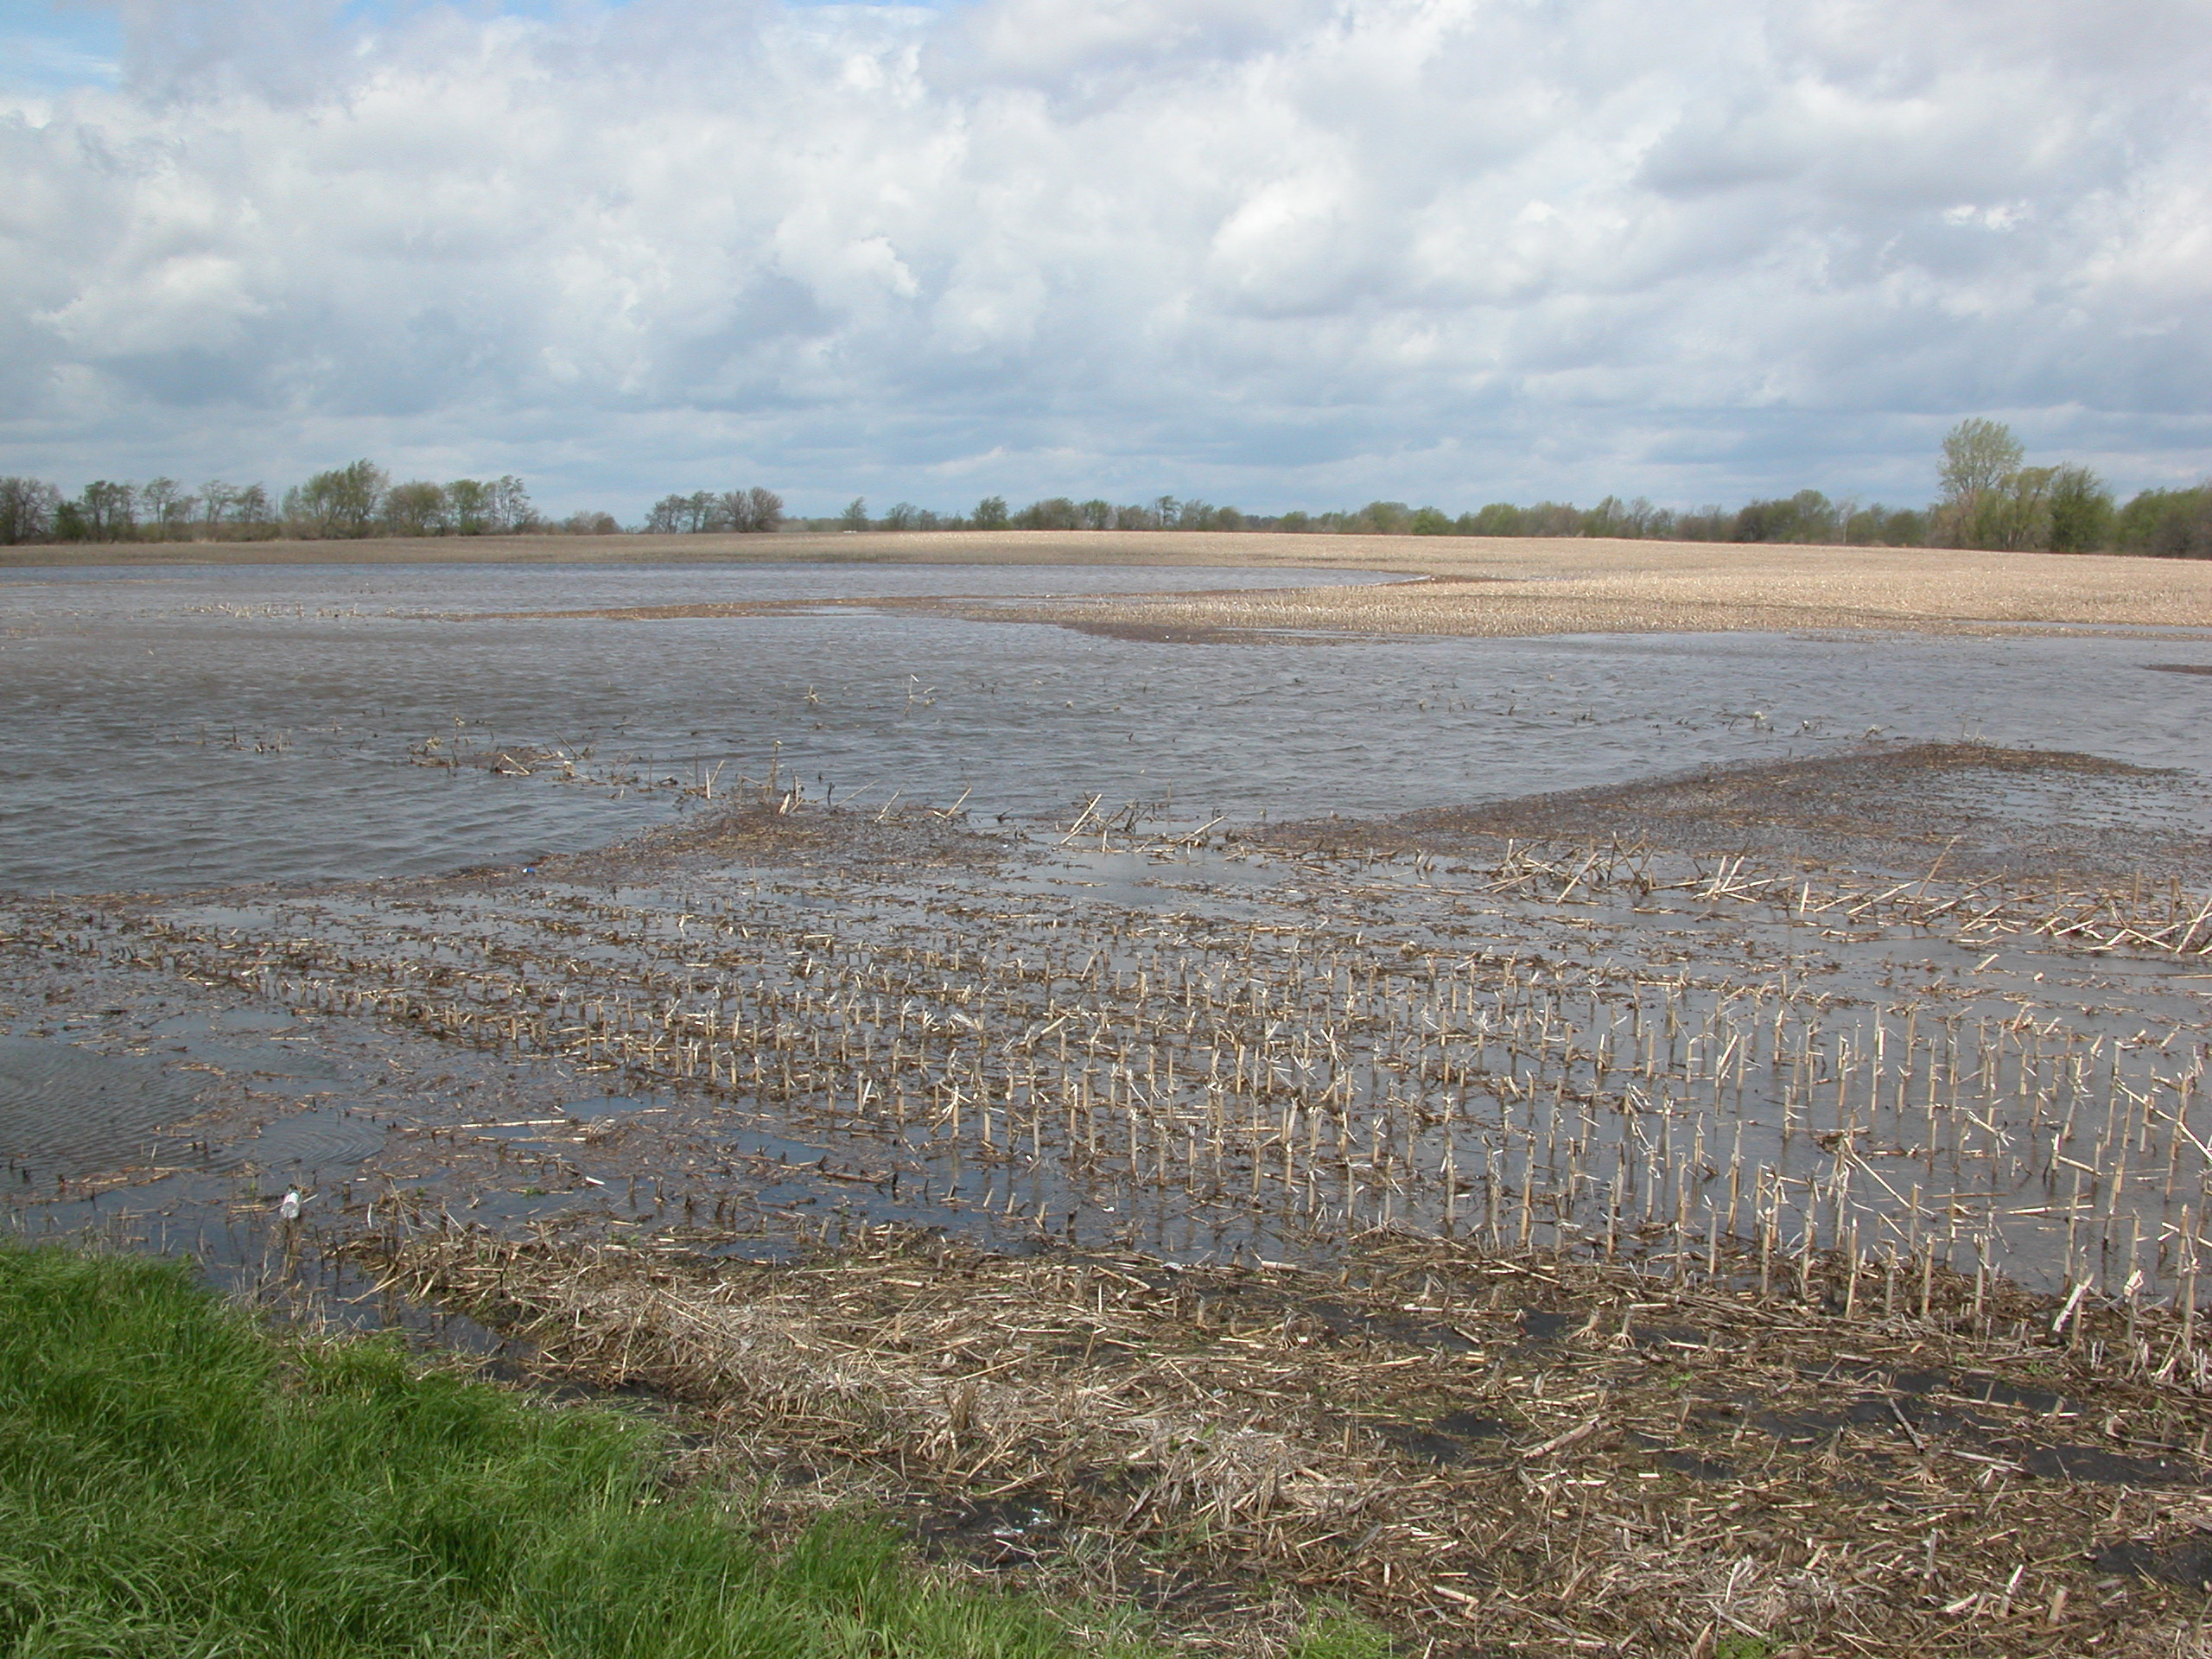
Lakes in fields that need to drain before tillage can be contemplated.
Conclusions:
Overall, the most essential aspects of tillage management for corn planting in Indiana and surrounding states over the next few weeks will be to exercise caution, control weeds, and enhance seedbed quality where possible. The worst possible combination would be doing secondary tillage when the soil is wet, and having that followed by hot and dry conditions during early development of corn seedlings.
The most important part of tillage system choice following periods of excessive spring rain is to limit soil damage and the creation of any root-restricting soil layers (during either the tillage or the corn planting operations). It is essential to leave the soil condition (following tillage and planting operations) with the maximum opportunity for unimpeded corn root development. Potential corn yields in 2011 can be compromised more by poor soil structure following poor tillage choices (whether the tool itself, operation timing, depth, and frequency) from now on than they have been by the planting delays thus far.
Eastern Cornbelt farmers cant control the rainfall amounts or rainfall timing on their fields. [If they could, they would gladly have shared all of their rain from the last 2 weeks with wheat and corn farmers in Kansas and Texas.] But corn farmers do have control over tillage/planting systems, and those choices now represent the principal soil management decisions required to get corn plants off to a healthy, though delayed, start in 2011. In the long-term, tillage system choices by corn farmers motivated by both economic and soil sustainability considerations will have to contend with keeping sufficient residue cover to contain soil erosion and improve soil surface structural stability and porosity. But short-term shifts (such as those outlined above) from the originally intended tillage operations might need to be adopted this spring.
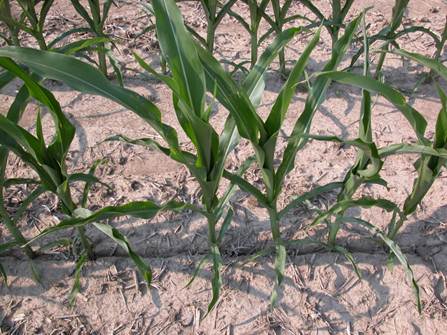
Seed furrow smearing while planting corn can add to potential drought stress damage later in the season.
![]()
“Safe” Hybrid Maturities for Delayed Corn Planting in Indiana – (Bob Nielsen)
It seems early to begin fearmongering about the possible necessity of switching to earlier relative hybrid maturities, but the similarities of this planting season with other late planting years is making some farmers fidget a little as they impatiently wait for fields to dry out. One of the biggest agronomic concerns with severely delayed planting is the risk of the crop not reaching physiological maturity before a killing fall freeze and the yield losses that could result. An economic concern with delayed planting is the risk of high grain moistures at harvest and the resulting costs incurred by drying the grain or price discounts by buyers.
The tables that accompany this article list “safe” relative hybrid maturities for corn planted throughout the month of May based on their heat unit requirements (adjusted for planting date) and anticipated “normal” accumulation of heat units between planting and an average date (50% probability) of a killing fall freeze. Because GDD accumulations are generally less and “usual” fall frosts occur earlier in the northern and eastcentral areas of Indiana, delayed planting forces hybrid maturity changes earlier than other areas of the state. However, even for those areas of Indiana, serious departures from “typical” hybrid maturities need not be considered until later in May.
The maturities listed in Table 1 are those that should reach physiological maturity at least by the week when a killing fall freeze occurs, while Table 2 lists hybrid maturities that should mature at least one week PRIOR to a killing fall freeze. When making a decision to plant hybrid maturities that are unusually early for your area of the state, make the effort to identify hybrids with good disease resistance traits.
| Table 1. Approx. "safe" relative hybrid maturities for late planting dates in Indiana with the objective that physiological maturity occurs at least by the week of the expected fall frost date. | |||||
| Crop Rpt District | "Typical" CRM | Expected Fall Frost Date | Planting Date | ||
| 1-May | 15-May | 31-May | |||
| Approx. "safe" relative maturity | |||||
| NW | 109 | 6-Oct | 113 | 112 | 109 |
| NC | 109 | 6-Oct | 113 | 112 | 108 |
| NE | 109 | 6-Oct | 111 | 109 | 106 |
| WC | 112 | 13-Oct | 118+ | 118+ | 118 |
| C | 112 | 13-Oct | 118+ | 118+ | 116 |
| EC | 109 | 6-Oct | 114 | 112 | 109 |
| SW | 116 | 20-Oct | 118+ | 118+ | 118+ |
| SC | 113 | 13-Oct | 118+ | 118+ | 118+ |
| SE | 113 | 13-Oct | 118+ | 118+ | 118+ |
| 50 pct fall frost risk date | |||||
| Table 2. Approx. "safe" relative hybrid maturities for late planting dates in Indiana with the objective that physiological maturity occurs at least one week before the expected fall frost date. | |||||
| Crop Rpt District | "Typical" CRM | Expected Fall Frost Date | Planting Date | ||
| 1-May | 15-May | 31-May | |||
| Approx. "safe" relative maturity | |||||
| NW | 109 | 6-Oct | 111 | 110 | 106 |
| NC | 109 | 6-Oct | 111 | 109 | 106 |
| NE | 109 | 6-Oct | 108 | 107 | 104 |
| WC | 112 | 13-Oct | 118+ | 118+ | 116 |
| C | 112 | 13-Oct | 118+ | 118 | 113 |
| EC | 109 | 6-Oct | 111 | 110 | 106 |
| SW | 116 | 20-Oct | 118+ | 118+ | 118+ |
| SC | 113 | 13-Oct | 118+ | 118+ | 118+ |
| SE | 113 | 13-Oct | 118+ | 118+ | 118+ |
| 50 pct fall frost risk date | |||||
The Crop Reporting Districts are those defined by the National Ag. Statistics Service, USDA, for Indiana. The acronym "CRM" refers to Comparative Relative Maturity as defined by Pioneer Hi-Bred.
Recognize that while the hybrid maturities listed in either table should safely mature by their respective dates, severely delayed plantings will likely mature at a later time in the fall when further grain drying in the field typically occurs at a proverbial snail’s pace. Thus, grain moisture at harvest for delayed plantings may be unacceptably high in terms of both the ease of harvest and the costs of artificially drying the grain.
Farmers can mitigate this aggravation somewhat by planting even earlier maturity hybrids, but recognize that there may not be as great of a difference in grain moisture content as you think. Typically, a one “day” difference in relative maturity rating equals 0.5 percentage point difference in grain moisture content at harvest (Nielsen, 2009). That means there will only be about 2 points difference between, say, a 106-day hybrid and a 110-day hybrid at harvest.
Related References
Nielsen, Bob. 2002 (rev). Estimating Yield and Dollar Returns From Corn Replanting. Purdue Univ. Cooperative Extension Service publication AY-264-W. Online at <http://www.agry.purdue.edu/ext/pubs/AY-264-W.pdf>. [URL accessed Apr 2011].
Nielsen, R.L. (Bob). 2009. Interpreting Corn Hybrid Maturity Ratings. Corny News Network, Purdue Univ. [online] <http://www.kingcorn.org/news/timeless/HybridMaturity.html>. [URL accessed Apr 2011].
Nielsen, R.L. (Bob) and Peter Thomison. 2003. Delayed Planting & Hybrid Maturity Decisions. Purdue Univ. Cooperative Extension Publication AY-312-W. [On-line]. Available at <http://www.agry.purdue.edu/ext/pubs/AY-312-W.pdf> [URL accessed Apr 2011].
Nielsen, Robert L., Peter R. Thomison, Gregory A. Brown, Anthony L. Halter, Jason Wells, and Kirby L. Wuethrich. 2002. Delayed Planting Effects on Flowering and Grain Maturation of Dent Corn. Agron. J. 94:549-558.
![]()
Thoughts on Seeding Rates for Corn – (Bob Nielsen)
Bottom line:
• Most Indiana corn growers should aim for economic final stands no less than about 30,000 plants per acre.
Read the full article for the gory details.
Of all the many agronomic management decisions a corn grower makes each year, one would think that choice of seeding rate would be among the simplest. Yet, this topic continues to garner a lot of attention in coffee shops, Internet chat rooms, the farm press, and in crop seminars. So, apparently this decision is not clear-cut.
I will admit that we agronomists are prone to re-visiting research topics every 10 to 20 years, partly because we wonder whether today’s genetics respond differently than yesteryear’s hybrids. Nevertheless, I tend to become skeptical when my seed company tells me that I need to increase my seeding rates in order to maximize my corn yield.
Identifying the optimum seeding rate for corn is akin to a balancing act among the various yield components that multiply together to determine grain yield: Plants per acre X Ears per plant X Kernels per ear X Weight per kernel. On the one hand, more plants per acre should equal more ears more acre which should be beneficial for optimizing yield. On the other hand, kernel numbers per plant and weight per kernel eventually decrease with increasing plant populations. That’s not good for optimizing yield. Consequently, the optimum final plant population is that which best balances the benefit of more ears per acre with the disadvantage of smaller ears and lighter grain. Furthermore, stalk health and integrity often falter as plant population increases beyond some maximum threshold.
Corn plant populations have been steadily increasing in Indiana for the past 25 years at approximately 300 plants per acre per year (Fig. 1). In 2010, the estimated average plant population statewide was just over 28,000 plants per acre (ppa). Considering an average percent emergence of 95%, this means that the average statewide seeding rate is probably around 30,000 seeds per acre (spa).
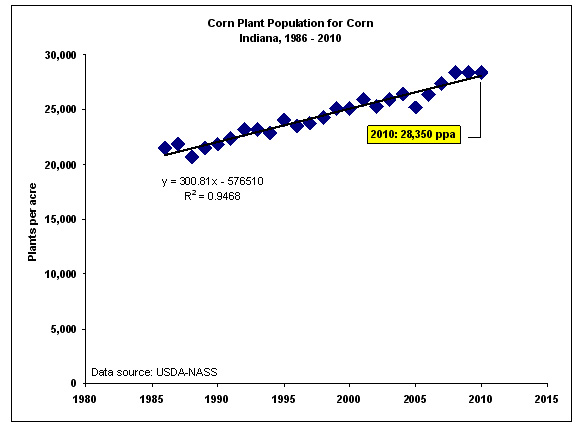
Fig. 1. Changes in reported corn pan populations in Indiana since 1986.
Statewide increases in plant population have occurred as growers have shifted from quite low seeding rates to intermediate and higher seeding rates (Fig. 2). In 1997, nearly 60% of Indiana’s corn acres reported final stands less than 25,000 ppa and only 8% with final stands greater than 30,000. Whereas in 2010, only 19% of Indiana’s acres were reported to be less than 25,000 ppa and nearly 41% of the acres were reported to be greater than 30,000 ppa. Among the changes that have allowed growers to steadily increase plant populations has been the genetic improvement in overall stress tolerance that has resulted in a) ear size and kernel weight becoming less sensitive to the stress of thicker stands of corn and b) improved late-season stalk health.
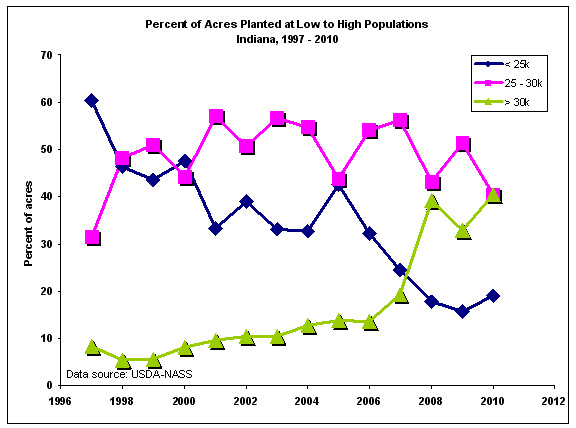
Fig. 2. Percent of Indiana corn acres with plant populations within three ranges of low to high, 1987-2010.
There are those who contend that an average statewide plant population of 28,350 is too low and that Indiana corn growers are missing out on opportunities for increased grain yields with increased plant populations. Seed companies, in particular, sometimes recommend to their customers that seeding rates should be in the neighborhood of 35,000 or higher to maximize yield and furthermore show yield response data that appear to support those recommendations. Results of some university research also tends to favor these higher seeding rates. Some farmers and consultants point to evidence from high yield corn contests, like that of the National Corn Growers Association, that supports the need for high seeding rates to achieve yields near or above 300 bushels per acre (bpa).
Given the steady, but small, annual rate of increase in seeding rates over the years (300 ppa/year), some growers question whether suddenly increasing their seeding rate by 5000 ppa or more in a single year is a wise decision. What questions should the healthy skeptic ask when presented with advice and recommendations for such high seeding rates?
Yield Response to Seeding Rates: Interpretation of the Data
Ultimately, the answer comes down to what the yield response data tell us. Therein lies the rub, because often we are not privy to the actual yield response data but only to the interpretation of the same. Interpretation of data involves the use of statistical analysis and statistical analysis involves decisions by the researcher on the appropriate mathematical models to rely on to determine optimum seeding rates.
Let’s begin with the coffeeshop scuttlebutt that the winners of the NCGA Corn Yield Contest are all using seeding rates of 40,000 or higher in order to achieve those 300+ bpa contest winning entries. While it is true that a fair number of those winners use exceptionally high seeding rates, it is also true that there is not much of a relationship between grain yield and harvest population among those NCGA Contest winners (Fig. 3).

Fig. 3. Grain yield versus harvest population for winners in the NCGA Corn Yield Contest, 2007-2010.
Let’s move on to interpretation of yield response data from seeding rate trials. To mathematically describe the yield response to plant population, there are alternative “shapes” or models of response curves to choose from (Fig. 4). From a statistical perspective, more than one model may “fit” or describe the response data well. This presents a challenge to the researcher to then determine which model most accurately describes the yield response data.
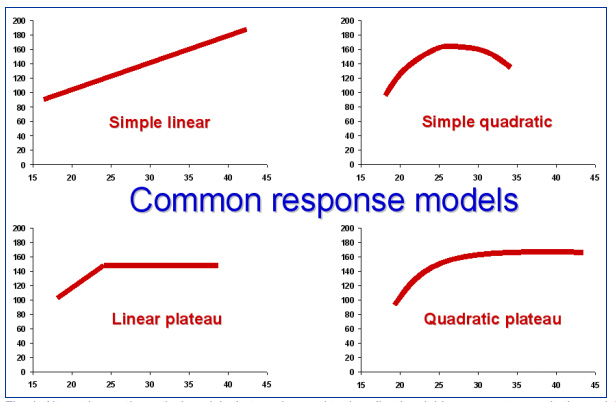
Fig. 4. Alternative mathematical models that can be used to describe the yield response to quantitative variables like seeding rate or nitrogen fertilizer rate.
If you are still reading at this point, you may well ask “Who cares as long as the model is a good statistical fit?”. It matters because the equation that describes the model is subsequently used to calculate or predict the optimum rate. Different equations can lead to different answers and those different answers may result in different economic consequences for the grower who implements the resulting recommendation. An example may help illustrate this quandary.
Figure 5 depicts the yield reponse to a range of six seeding rates. The graph clearly illustrates that grain yield increases with higher seeding rates, but seems to level out beyond about 30,000 ppa.
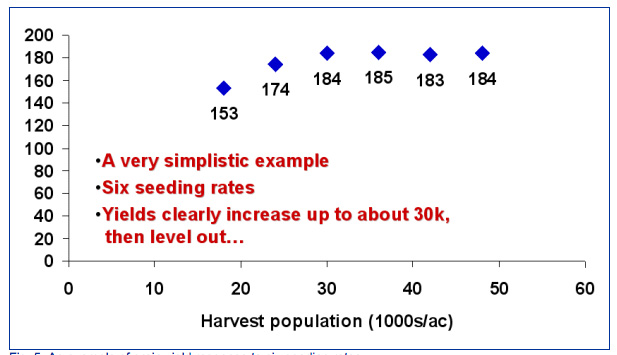
Fig. 5. An example of grain yield response to six seeding rates.
One could “fit” a straight line (simple linear response curve) model to the data set and fairly accurately describe the yield response to seeding rate (Fig. 6). The “R2” value displayed beneath the line is the statistical value that describes how well the equation for the line “fits” the data set. The closer this value is to “1”, the more accurately it describes the data set. For some field research, an “R2” value of 0.61 would be pretty acceptable. If you accepted this linear response model, you would conclude that grain yield would continue to increase as seeding rates increase, i.e., the sky is the limit.
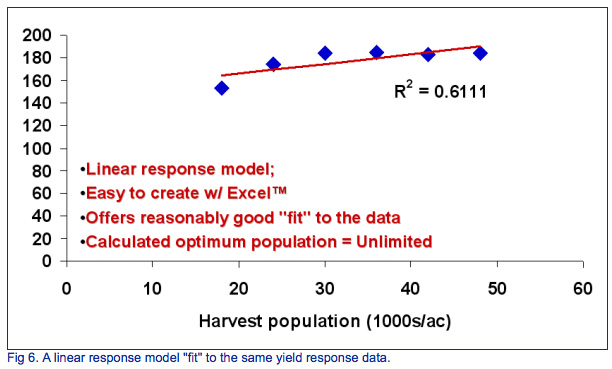
Fig. 6. A linear response model "fit" to the same yield response data.
Figure 7 uses a quadratic response curve to describe the data set. The curve itself suggests that yield increases to a maximum, then decreases at seeding rates beyond the maximum. The “R2” value for this response model (0.94) is better than for the linear response model and, frankly, most researchers would be excited to see such a good statistical fit.

Fig. 7. A quadratic response model "fit" to the same yield response data.
Figure 8 illustrates the use of a quadratic-plateau response curve to describe the same data set. The model suggests that yields increase with increasing seeding rates to a point, then levels out at higher seeding rates. The “R2” value for this response model (0.997) implies that the model almost perfectly describes the yield response to seeding rate, although technically the simpler quadratic response curve with an “R2” value of 0.94 is a perfectly acceptable statistical “fit” to the data set.

Fig. 8. A quadratic-plateau response model "fit" to the same yield response data.
So, here is the quandary. Two of the possible response models do an excellent job of statistically describing yield response to seeding rate. Statistically, you can’t go wrong with either one. However,
• If you accepted the quadratic response model, the optimum seeding rate predicted from the equation would be 39,000 ppa.
• If you accepted the quadratic-plateau response model, the optimum seeding rate predicted from the equation would be 32,000 ppa or 7,000 fewer plants per acre than the optimum rate calculated from the simpler quadratic response model.
Using a fairly common seed cost of $3 per thousand ($240/80k bag), following the recommendation based on the quadratic response model would translate to an additional $21 per acre in seed cost for the grower with no assurance that yields would actually be any higher than if the grower had used the lower seeding rate recommendation based on the quadratic-response model.
Bottom Line
The consequence of this simple example is that researchers bear a responsibility to growers to carefully analyze and interpret yield responses to quantitative crop inputs such as seeding rates or nitrogen fertilizer rates. Based on my interpretation of yield response data from both university and commercial seeding rate trials, I conclude that yield response of today’s hybrids to seeding rates can often be described by quadratic-plateau models.
With that premise, I believe that the data suggest that most Indiana corn growers should be targeting final plant populations no less than 30,000 ppa or seeding rates of around 33,000 spa. The primary exception to this interpretation would be those soils or growing conditions that severely limit yield potential (e.g., droughty sandy soils). For those challenging conditions, targeted plant populations should be closer to the mid-20’s.
One Last “Fly in the Ointment”
Having gone to all the trouble to discuss differences in yield response models, let me toss out this curve ball to the story. Since 2001, I have conducted 19 field-scale trials throughout the state evaluating corn yield response to seeding rates. These data represent seven individual growing seasons and thirteen different locations around the state. Some of these have been on Purdue’s outlying research farms, others have been in collaboration with on-farm cooperators. Harvest plant populations in these trials have mostly ranged from the mid-20’s to the low 40’s (thousand ppa). The aggregated data for grain yield response to plant population are illustrated in Fig. 9. Across those 19 trials, yield response to plant population has essentially been flat.
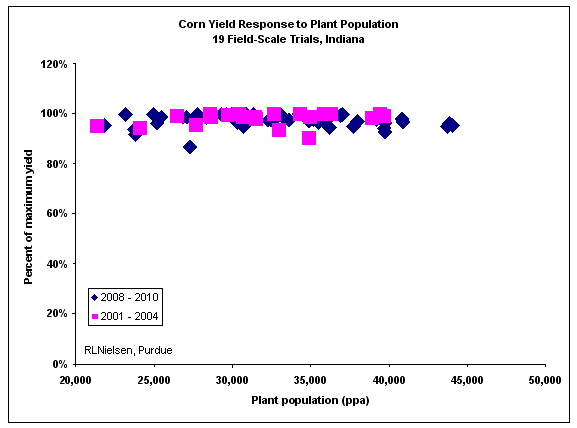
Fig. 9. Corn grain yield response to plant population. Nineteen field-scale trials through Indiana since 2001.
Technically, I can “fit” a quadratic-plateau model to the data set that predicts an optimum final stand of 30,203 ppa, but the “R2” value for this response model is only 0.06 which means there is not much of a relationship with the data. In the absence of a statistically significant response curve, my interpretation of the data from those 19 trials is that yields from harvest populations greater than 30,000 ppa were no higher than yields from harvest populations of 30,000 ppa or less.
Opportunities for On-Farm Research
The nearly flat yield response to plant population represented by these 19 trials is the reason I am encouraging folks to consider participating in collaborative seeding rate trials yet this year and beyond to help further define grain yield response to plant population. If rain has kept you from planting yet this season, there is still time to think about an on-farm seeding rate trial. Download the protocol for this at <http://www.agry.purdue.edu/ext/ofr/protocols/PurdueCornSeedingRateProtocol.pdf> and contact me for additional information.
![]()


![]()