
Pest & Crop Newsletter, Entomology Extension, Purdue University
- What Makes a Black Cutworm Infestation?
- Weevil Development and Damage Will Accelerate this Weekend
- Black Cutworm Adult Pheromone Trap Report
What Makes a Black Cutworm Infestation? - (Christian Krupke and John Obermeyer)
- Black cutworm moths are dependent on south-westerly storms, green plants, and favorable temperatures.
- Every year they arrive in our state, most years populations crash without our intervention.
- Moth arrival this year has not really begun yet.
Many factors (some of them unpredictable) determine an insect outbreak. As we take the wait and see approach toward planting and subsequent insect infestations, lets list a few of the variables:
Insect dispersal is the phenomenon by which insects move from one place to another. The distance that they are able to move is quite variable among species. Black cutworm moths, on their own power, can fly no further than a few miles. However, they use what energy they have to fly straight up. Once in the jetstream, they are often caught up in wind currents in southern regions of the United States and carried to the Midwest. They are then deposited back to ground level by spring storms. Predicting the location and intensity of a spring thunderstorm is difficult, and therefore so is the prediction of infestations of cutworms and other migratory pests. This is where pheromone trapping is useful: with the help of our loyal cooperators throughout the state we are able to keep an eye on the “arrival rate” and know when to start scouting. As you can see from the following report, moths are being captured presently, but numbers are still low. We are still waiting for that significant, large influx from the Southwest.

Male black cutworm moths doomed by the scent of a female (pheromone).
Although many adult insects don’t feed, food sources are a necessity for larval insects (caterpillars, grubs etc.) to survive. Black cutworm females moths, laden with eggs, cue in to green plants for egg-laying soon after their arrival. As mentioned last week, winter annual weeds are very attractive egg-laying sites. When these weeds are destroyed after egg-laying, surviving larvae are very limited in mobility, and will feed upon anything within reach. This is when damage to the crop can happen. Though in preference tests, corn and soybean are not their favorite foods, this is far preferable to starving.
Temperature dictates all insect activity, rate of development, and reproduction. Insects are cold-blooded and they require an external heat source, meaning they respond very strongly to changes in temperature. The temperature above which an insect grows and develops is called a developmental threshold. The minimum threshold for black cutworm has been established at 50ºF. At temperatures lower than this (quite common in Indiana springs) they remain inactive until conditions become favorable. Though adults and larvae can freeze to death, short periods below freezing are not sufficient to kill them – this is not typically a large source of mortality at this time of year.
In predicting insect infestations, timing is everything. There are other variables to consider, but timing of when and how all these factors (migration, food availability, development temps) “collide” ultimately determines the infestation. Hopefully this gives a clearer understanding of why cutworm outbreaks, although serious when they occur, are few and far between. Reliance on prophylactic control measures (for example, seed treatments) for black cutworm, which have gone on for years, is mostly overkill, because Mother Nature usually beats us to the punch.
![]()
Weevil Development and Damage Will Accelerate this Weekend - (Christian Krupke and Larry Bledsoe)
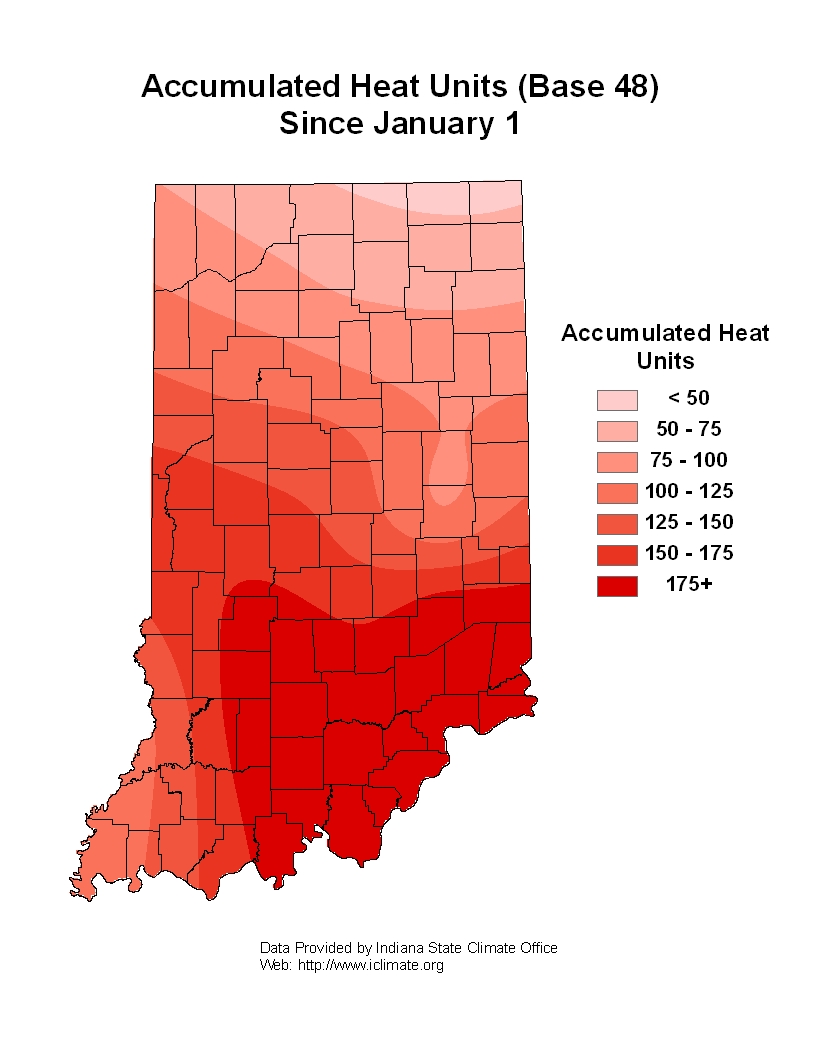
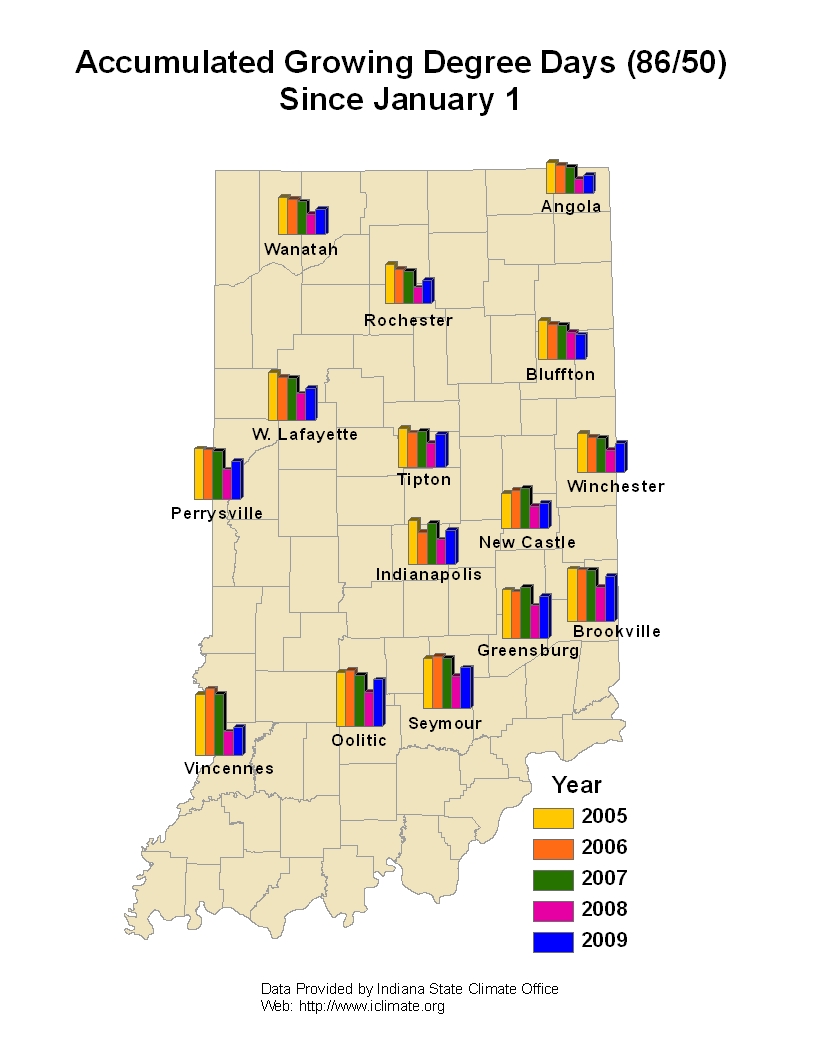
David Trotter, Clark County CES (near Louisville, KY), rechecked some alfalfa fields this past week and found that percent weevil tip-feeding was still in the mid-40’s, but larvae have grown slightly. Obviously, the cool temperatures have kept weevil development to a minimum. What this means is that larvae will get larger, as will their damage, and many eggs will be hatching as temperatures increase over the next few days as temperatures are expected to increase significantly. See the following heat unit (base 48) map. Scouting should commence at approximately 200 heat units (48ºF base) have accumulated. We would encourage pest managers in extreme southern Indiana to inspect alfalfa fields after this much-needed temperature surge.
![]()
Click here to view the Black Cutworm Adult Pheromone Trap Report
![]()
Soybean Rust Update – (Kiersten Wise)
Soybeans have not yet been planted in Indiana, but there is already interest in what the risk of soybean rust infection will be for 2009. Currently, soybean rust is confined to a few areas of kudzu in the deep south. No infections have been reported on soybean yet in any of the southern states.
It is difficult to predict the risk of soybean rust infection to Indiana soybeans at this time, but we will be monitoring the situation closely. Indiana will have sentinel plots established in 2009 which are inspected weekly for soybean rust and other diseases beginning in late June or early July. Support for the 2009 sentinel plot system in Indiana is provided by the Indiana Soybean Alliance and the North Central Soybean Research Program.
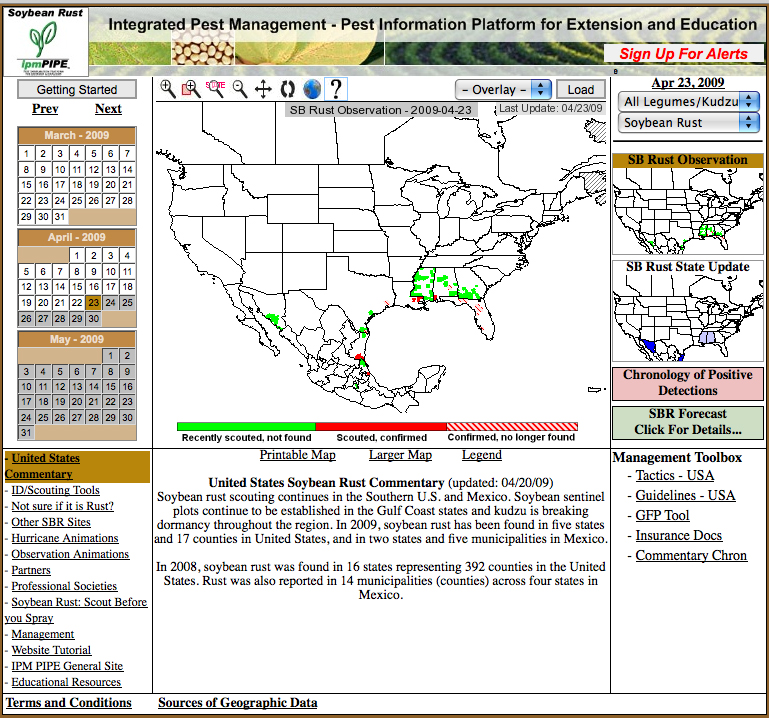
Weekly updates on the Indiana soybean disease monitoring efforts can be found online at the soybean rust ipmPIPE Web site at <http://www.sbrusa.net> (Figure 1). This website provides up-to-date information on locations with confirmed soybean rust infection, and it is an excellent resource for information on soybean rust.
Purdue University also maintains a toll-free soybean rust phone hotline, which is updated weekly beginning in late June. The phone number is 866-458-RUST (7878). We will also provide updated commentary in the Pest and Crop newsletter as the season develops.
Finally, there have been some changes in fungicide registrations for soybean rust. An updated version of fungicides available for soybean rust management can be found at <http://www.ppdl.purdue.edu/PPDL/SBR/SBR_fungicide.html>.
![]()
Corn Planting Date is Important, But.... - (Bob Nielsen)
- Early planting favors higher yields, but does not guarantee higher yields.
- Statewide averages for planting date and yield are not strongly related.
- Planting date is but one of many yield influencing factors.
Conventional wisdom says that the prime planting window for maximum corn yields in much of Indiana opens about April 20 and closes about May 10. This “window” typically opens about one week later across the northern tier of Indiana counties (cooler conditions) and about one week earlier across the southern tier of Indiana counties (warmer conditions).
Very little corn, if any, has been planted in Indiana to date. By itself, this is not much cause for concern because typically only a very small percentage of acres are ever planted by this date in Indiana. However, the specter of delayed planting is clearly on the horizon because little other spring fieldwork has been completed due to the frequent and sometimes excessive rainfall in recent weeks. For many growers, tillage operations, herbicide applications, and nitrogen fertilizer applications must be completed first before they can consider planting their crops.
What are the consequences of a delayed start to planting? How important a predictor of statewide corn yield is planting date anyway? Does late planting in and of itself guarantee lower than normal yields? Interestingly, the planting date effect on statewide average corn yield is not clearcut.
If one reviews USDA-NASS crop progress reports for the past 18 years (USDA-NASS, 2008), there is NOT a strong relationship between planting date and yield on a statewide basis. Specifically, departures from annual trend yield are not strongly related to corn planting progress. Figures 1 through 3 illustrate this relationship for three measures of planting progress; percent acres planted by April 30, percent acres planted by May 15, and percent acres planted by May 31. Even though one can technically define a linear relationship between departure from trend yield and planting progress by April 30 or May 15, the relationship only accounts for about 24% of the variability in yield departure year to year (Fig’s 1 & 2). In other words, a number of yield influencing factors (YIFs) other than planting date affect the ultimate maximum yield for a given year.
So what’s the deal? Why is it that every corn agronomist known to man preaches about the importance of timely planting and yet the statewide statistical data suggest that planting date accounts for only 24% of the variability in statewide yields from year to year? Let’s think more closely about this seeming paradox.
It is true that corn grain yield potential does indeed decline with delayed planting after about May 1 (Nafziger, 2008). The yield loss per day varies from about 1 bu/ac/day early in May to nearly 2 bu/ac/day by the end of May. Yield potential decreases with delayed planting because of a number of factors, including a shorter growing season, insect & disease pressure, and moisture stress during pollination.
However, the good news is that planting date is but one of many YIFs for corn. What is important to understand is that yield loss to delayed planting is relative to the maximum yield possible in a given year. In other words, if all the other YIFs work together to determine that the maximum possible yield this year is 200 bu/ac, then the consequence of a 10-day planting delay beyond May 1 (at 1 bu/ac/day) would be a yield potential of 190 bu/ac (i.e., 200 bu/ac potential minus 10 bu/ac due to delayed planting). However, if all the other YIFs work together to determine that the maximum possible yield this year is only 160 bu/ac, then the consequence of a 10-day planting delay beyond May 1 (at 1 bu/ac/day) would be a yield potential of 150 bu/ac (i.e., 160 bu/ac potential minus 10 bu/ac due to delayed planting). Make sense?
Consequently, it is possible for early-planted corn in one year to yield more than, less than, or equal to later-planted corn in another year depending on the exact mix of YIFs for each year. That is the reason why statewide average corn grain yields frequently vary by plus or minus 10% from the expected trend yield from year to year.
For example, the crop years 1997 and 1993 represent early and late planting dates in Indiana (Fig. 2). About 80% of the state’s crop was planted by May 15 in 1997, but only 46% of the crop was planted by May 15 of 1993. Yet, the earlier planted 1997 crop yielded 8.3% BELOW trend yield for that year and the later planted 1993 crop yielded 3.4% ABOVE trend yield. Why? Important differences in YIFs between the years other than simply planting date.
Bottom Line
Let’s not succumb quite yet to fearmongering triggered by the prospects of a delayed start to corn planting in 2009. “Mudding in” a crop early to avoid planting late will almost always end up being an unwise decision. While important, planting date is only one of many yield-influencing factors for corn.
Another reason that it is probably too early to fearmonger about the anticipated late start to planting is that growers have the machinery capacity to “catch up” quickly once the weather and soil conditions become favorable for planting. The 1992 planting season began as one of the slowest (Fig. 1) but quickly recovered within two weeks to a respectable pace (Fig. 2) and finished the season with the largest POSITIVE departure from trend yield in the past 18 years. We also know from past years’ experiences that, on average, 50% of the state’s corn crop is typically planted over about an 18-day period (Fig. 5). Furthermore, it is not unheard of for growers to plant 45 to 50% of the state’s crop in a single week given good working conditions (Fig. 6).
References
Nafziger, Emerson. 2008. Thinking About Corn Planting Date and Population. The Bulletin (No. 2, Article 7, April 4), Univ. of Illinois Extension. [On-line]. Available at <http://www.ipm.uiuc.edu/bulletin/article.php?id=890>. [URL accessed 4/12/08].
USDA-NASS. 2008. Crop Progress and Condition. USDA, National Agricultural Statistics Service. [On-line]. Available at <http://www.nass.usda.gov/Statistics_by_State/Indiana/Publications/
Crop_Progress_&_Condition/index.asp>. [URL accessed 4/12/08].
Fig. 1. Percent departure from trend yield versus percent of corn acres planted by April 30 in
Indiana, 1991-2008.

Fig. 2. Percent departure from trend yield versus percent of corn acres planted by May 15 in
Indiana, 1991-2008.

Fig. 3. Percent departure from trend yield versus percent of corn acres planted by May 31
in Indiana, 1991-2008.
Fig. 4. Departure from trend yield versus the date when at least 50% of Indiana’s corn
crop was planted, 1983 - 2008.
Fig. 5. Corn planting progress in Indiana during the years 1999 through 2008.
Fig.6. The fastest single week of corn planting progress in Indiana for individual years
from 1991 through 2008.
![]()