
Pest & Crop Newsletter, Entomology Extension, Purdue University
Control of Marestail in No-till Soybeans - (Mark Loux, The Ohio State University, Bill Johnson and Glenn Nice, Purdue University)
Marestail Biology
• Marestail (also known as horseweed) is one of the most problematic weeds in no-till soybeans in Ohio and Indiana.
• Marestail has two primary periods of emergence – from late summer into fall, and from late March through June. It is one of the first annual weeds to emerge in the spring and is present before crops are planted.
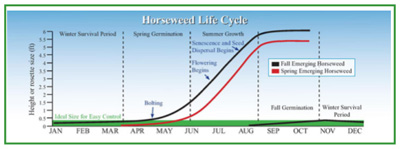
• Marestail plants remain in the low-growing rosette stage through late April, followed by stem elongation (bolting) and growth to an eventual height of 3 to 6 feet. Plants that emerge the previous fall will start stem elongation earlier than spring-emerging plants.
• Marestail competes with the soybeans during the growing season, reducing yield. It matures in late summer or early fall, late enough to interefere with soybean harvest.
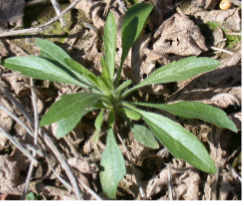
Marestail (also known as horseweed)
Herbicide Activity and Resistance in Marestail
• Herbicide programs must consist of a burndown to ensure that the field is free of marestail at the time of soybean planting, and residual (PRE) herbicides to control marestail for another 6 to 8 weeks. Where marestail emerge between an early spring burndown and planting, additional burndown herbicide should be applied before soybeans emerge.
• Marestail is most readily controlled when in the rosette stage, and herbicides should always be applied before plant height exceeds 4 inches. Larger plants become difficult to control, even when not herbicide-resistant.
• Marestail populations with resistance to glyphosate or ALS inhibitors (e.g., Classic, FirstRate) are widespread throughout Ohio and Indiana, which increases the difficulty of control. Populations with multiple resistance, to both glyphosate and ALS inhibitors, have also been confirmed.
• Only a few POST soybean herbicides have activity on marestail – glyphosate, Ignite, chlorimuron (Classic), and FirstRate. POST herbicides are effective primarily when plants are newly emerged and several inches tall, and only in populations that are not herbicide-resistant, with the exception of Ignite in Liberty Link soybeans.
Key Points for Controlling Marestail in No-till Soybeans
• Do not plant into existing stands of marestail. Start weed free at the time of planting by using tillage or a preplant herbicide treatment of one of the following, applied when marestail plants are less than 4 inches tall.
* 2,4-D ester plus glyphosate (1.5 lb. ae/A)
* 2,4-D ester plus Gramoxone (3 to 4 pts./A) plus a metribuzin-containing herbicide
* 2,4-D ester plus Ignite (29 to 36 oz./A) plus a metribuzin-containing herbicide
* Sharpen (1 oz./A) plus either glyphosate or Ignite
• The burndown effectiveness of any of these can often be improved by incuding a residual herbicide that contains chlorimuron (e.g., Canopy, Valor XLT, Envive) or cloransulam (e.g., Gangster, Sonic, Authority First).
• Use the highest rate of a 2,4-D ester product that is allowed, based on the interval between application and soybean planting. For all 2,4-D ester products, rates up to 0.5 lb. active ingredient per acre must be applied at least 7 days before planting. Rates between 0.5 and 1.0 lb. should be applied at least 30 days before planting, with the exception of several products (e.g., E-99, Salvo, and Weedone 650) that allow these rates to be applied 15 days before planting.
• Where it is not possible to use 2,4-D ester, a combination of Sharpen plus either glyphosate or Ignite will effectively control emerged marestail prior to soybean emergence. A combination of Ignite (29 to 36 oz./A) and metribuzin (at least 0.38 lb. ai/A) is also usually effective. Other potentially effective options include combinations of glyphosate plus a herbicide containing chlorimuron or cloransulam (results can be variable depending upon size of the marestail and herbicide resistance).
• Include one or more of the following PRE herbicide(s) for residual control of marestail:
| ALS-Sensitive Populations | ALS-Resistant Populations |
| Authority Assist Authority First Authority MTZ Canopy DF/EX Enlite Envive FirstRate Gangster metribuzin Python Sonic Spartan Synchrony Valor Valor XLT |
Authority Assist Authority First Authority MTZ Enlite Envive Gangster metribuzin Sonic Spartan Valor Valor XLT |
• Where POST treatments are needed, apply when marestail are less than 6” tall. The most effective POST treatment sin Roundup Ready soybeans include combinations of glyphosate plus Classic or FirstRate.
Consider Liberty Link Soybeans
Liberty Link soybeans are an effective tool for management of herbicide-resistant marestail populations. The most effective approach includes application of burndown and residual herbicides as indicated above, to ensure a weed free start at planting and residual control. This can be followed with one or tow POST applications of Ignite as needed to control later-emerging marestail, when plants are less than 6 inches tall. The current Ignite label allows use of Ignite in either the burndown or the POST treatments, but not both.
What About Fall Herbicide Treatments?
Residual herbicides are most effective and long-lasting when applied in the spring, not in the fall. Fall herbicide treatments can be used to manage emerged marestail, winter annuals, and dandelions, but should generally be followed by a spring preplant treatment that includes residual herbicides (in other words, don’t substitute the fall treatment for a spring preplant treatment). Do not expect a fall herbicide treatment to adequately control marestail that emerges in May or June. Where a fall application is necessary, we suggest applying either: glyphosate + 2,4-D; or 2,4-D + a low rate of Canopy EX or Canopy DF. This should be followed with a spring preplant application of residual herbicide (plus 2,4-D, glyphosate, Gramoxone or Sharpen as needed).
Note on glyphosate rates. Glyphosate rates are shown here as “lbs. ae/A”, or “pounds of acid equivalent per acre”. The rate of “1.1 lb. ae/A” corresponds to: Roundup WEATHERMAX/PowerMAX – 33 oz./A; Touchdown Total/Duramax – 36 oz/A; all glyphosate products containing 3 lbs. glyphosate acid per gallon – 48 oz./A. See Table 23 in the Weed Control Guide for Ohio and Indiana” for more information <http://www.btny.purdue.edu/Pubs/WS/WS-16>.
Soybean Rust Confirmed in Indiana – (Kiersten Wise)
Soybean rust was confirmed in Indiana on September 30th, on soybean leaves collected in southeast Posey county. The soybean field where rust was found was at R7 and rust was detected at very low levels. Pustules were observed on 14 out of 100 leaves. Severity was low, with 1-2 pustules on each infected leaf.
It is likely that soybean rust may be present at low levels in other areas in southern Indiana. However, the level of disease in Indiana is very low at this time, and the vast majority of the soybean crop is past the growth stage where economic damage from soybean rust infection would occur.
Currently there are NO spray advisories issued for soybean rust at this time in Indiana. If there are concerns about whether or not fungicide application is warranted in specific fields (extremely late planted double-crop soybeans) please contact me at kawise@purdue.edu, or by phone (765-496-2170) before applying fungicides for soybean rust control. More information about soybean rust can be found on the Web at <http://www.sbrusa.net>.
![]()
Gibberella Ear Rot of Corn – (Charles Woloshuk and Kiersten Wise)
Gibberella ear rot, or Gib ear rot, is caused by the fungus, Gibberella zeae (Fusarium graminearum). This disease can occur throughout Indiana, but it tends to be more prevalent in the northern half. The pathogen overwinters on corn and wheat debris. Spores produced on the debris lead to infection during the silking period. There is a higher incidence of Gib ear rot when cool, wet weather occurs during the first 21 days after silking. It will be most severe in fields where corn followed corn and where corn followed wheat affected by Fusarium Head Blight (Scab), which is caused by the same pathogen.
This bulletin describes:
1. How to recognize the disease
2. Danger to animals
3. How to minimize losses and handle diseased grain after harvest
4. How to manage the disease
Recognizing the Disease
Gib ear rot can be readily identified in the field on intact ears, but it is much more difficult to identify once the grain has been shelled. The easiest and most accurate visual detection of Gib infection can be made just before a field is harvested. Inspect at least 10 ears in several locations in a field prior to harvesting by peeling back the husks and observing the ears. Look for a pink to reddish mold that begins at the tip of the ear and develops toward the base (Figures 1 and 2). The pinkish mold is typically diagnostic of Gib ear rot. Severely affected ears may be largely rotted with husks and silks adhering tightly to the ear and may have a pink to reddish mold growing between the husks and the ear. Except in highly susceptible hybrids, the disease usually involves only part of the ears.
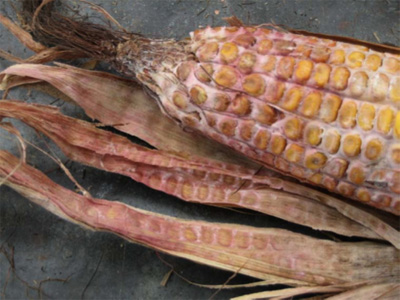
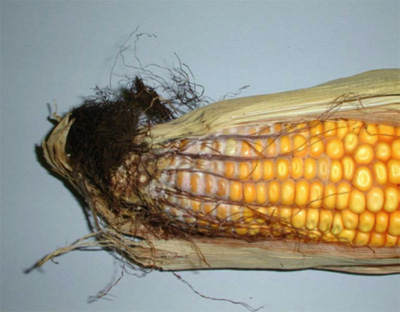
Figures 1 and 2. The pinkish mold present at the ear tip is diagnostic of Gibberella ear rot.
Danger to Animals
The pathogen that causes Gib ear rot can produce two mycotoxins in the infected kernels, deoxynivalenol and zearalenone. These mycotoxins can impact the health of many monogastric animals, but swine are especially sensitive. If Gib ear rot is present, one should assume that the mycotoxins are also present. A test is needed to determine the level of contamination. Contact your county educator or the Purdue mycotoxin specialist for information about testing options.
Deoxynivalenol, also known as DON and vomitoxin, causes swine and other animals to refuse infected grain and/or regurgitate feed. Zearalenone has estrogenic properties, which lead to infertility, abortion, or other breeding problems. As little as 1 to 5 ppm zearalenone in a feed ration may produce an estrogenic effect in swine.
The Food and Drug Administration has established DON advisory levels for animals as follows:
| Animal Affected | Maximum DON Level Allowed |
| Swine | 5 ppm (not to exceed 20 percent of ration with finished feed = 1 ppm) |
| Ruminating beef and feedlot cattle, over 4 months old | 10 ppm (not to exceed 50 percent of diet, with finished feed = 5 ppm) |
| Poultry | 10 ppm (not to exceed 50 percent of diet, with finished feed = 5 ppm) |
| All other animals | 5 ppm (not to exceed 40 percent of diet) |
The Food and Drug Administration has established DON advisory levels for animals as follows:
| Deoxynivalenol (vomitoxin, DON) | |||
| Swine | Concentration | Duration | Effect |
| Feeder pigs | 5-10 ppm | 1-5 days | 50% reduction in feed intake, vomiting |
| Feeder pigs | 10-40 ppm | 1-5 days | Complete feed refusal, vomiting |
| Sows | 3-5 ppm | Gestation, lactation | Lower fetal weights, or no effect |
| Zearalenone | |||
| Swine | Concentration | Duration | Effect |
| Prepubertal gilts | 1-5 ppm | 3-7 days | Hyperestrogenism, prolapse |
| Sexually mature open gilts | 3-10 ppm | Mid-cycle (day 11-14) | Anestrus, pseudopregnancy |
| Bred sows | 15-30 ppm | 1st trimester | Early embryonic death, small liters |
| Juvenile boars | 10-50 ppm | Indefinite | Reduced libido, small testicles |
| Mature boars | 200 ppm | Indefinite | No effect |
| Source: Munkvold, G., Osweiler, G., Hartwig, N. 1997 Iowa State University Ext. PM-1698 | |||
Minimizing Economic Losses
Fields with significant amounts of Gib ear rot should be harvested as early as possible and handled separately. Mycotoxin concentrations are almost always higher in fines and screenings. Adjust combines to reduce the amount of fines and small, shriveled or broken kernels. Grain should be dried to 15% or lower moisture immediately after harvest. Proper storage at or below 15% moisture will prevent further fungal growth and mycotoxin production.
Managing the Disease
To prevent a re-occurrence of Gib ear rot, tillage following a corn rotation is encouraged. Rotation out of corn (or wheat) will allow infected residue to degrade, reducing the presence of the causal fungus. Corn hybrids vary in their resistance to Gib ear rot. Check with your local seed dealer to find information on the availability of resistant varieties.
Partial List of Grain Inspectors Offering DON Analysis in Indiana:
The presence and amount of DON from infected grain can only be verified through chemical analysis. There are a variety of commercial laboratories and quick test kits for mycotoxin analysis. Romer Labs <http://www.romerlabs.com> and Neogen <http://www.neogen.com/> sell test strips for toxin analysis. For information about DON and other commercial laboratories visit the links at NC1025: Mycotoxins: Biosecurity and Food Safety <http://www.btny.purdue.edu/NC1025> Two grain inspectors in the central and north-central regions of Indiana that analyze grain for DON are listed here:
East Indiana Grain Inspection, Inc.
7020 North Walnut Street
Muncie, IN 47303-9796
765-744-6425
FAX 765-289-1206
Dan W. Gross, President and Official Agency Manager
e-mail: dwgross@comcast.net
Titus Grain Inspection, Inc.
1111 East County Road 800 North
West Lafayette, IN 47906-9006
765-463-3713
FAX 765-497-2202
Darwin E. Titus, Official Agency Manager
Nancy Titus, President
e-mail: titusgraininsp@aol.com
Test Weight Issues in Corn – (Bob Nielsen)
Among the top 10 most discussed (and cussed) topics at hometown cafes during harvest season is the test weight of the grain being reported from corn fields in the neighborhood. Test weight is measured in the U.S. in terms of pounds of grain per volumetric bushel. In practice, test weight measurements are based on the weight of grain that fills a quart container (32 qts to a bushel) that meets the specifications of the USDA-FGIS (GIPSA) for official inspection (Fig. 1). Certain electronic moisture meters, like the Dickey-John GAC, estimate test weight based on a smaller-volume cup. These test weight estimates are reasonably accurate but are not accepted for official grain trading purposes.
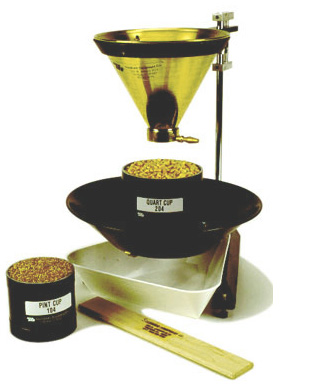
Fig. 1. A standard filling hopper and stand for the
accurate filling of quart or pint cups for grain test
weight determination.
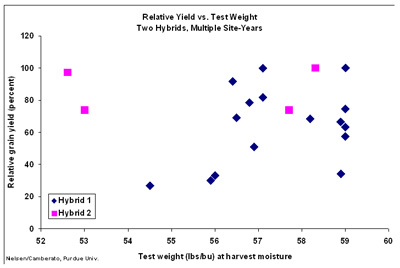
Fig. 2. Relative grain yield versus test weight for two hybrids and multiple site-years in Indiana, 2006-2009 (Nielsen & Camberato, Purdue University).
The official minimum allowable test weight in the U.S. for No. 1 yellow corn is 56 lbs/bu and for No. 2 yellow corn is 54 lbs/bu (USDA-GIPSA, 1996). Corn grain in the U.S. is marketed on the basis of a 56-lb “bushel” regardless of test weight. Even though grain moisture is not part of the U.S. standards for corn, grain buyers pay on the basis of “dry” bushels (15 to 15.5% grain moisture content) or discount the purchase price to account for the drying expenses they will incur with corn grain wetter than 15 or 15.5% moisture.
Growers worry about low test weight because local grain buyers often discount their offered price to farmers for low test weight grain. In addition, growers are naturally disappointed when they deliver a 1000-bu semi-load of grain with an average 52-lb test weight because they only get paid for 929 56-lb “market” bushels (52,000 lbs ÷ 56 lbs/bu).
On the other hand, high test weight grain makes growers feel good when they deliver a 1000 bushel semi-load of grain with an average 60 lb test weight because they will get paid for 1071 56-lb “market” bushels (60,000 lbs ÷ 56 lbs/bu). These emotions encourage a belief that high test weight grain is associated with high grain yields (lbs. of dry matter per acre) and vice versa. However, there is little evidence in the research literature that corn test weight is strongly correlated with grain yield.
Hybrid variability exists for grain test weight, but also does not necessarily correspond to differences in genetic yield potential. Test weight for a given hybrid can vary from field to field or year to year, but does not necessarily correspond to the yield level of an environment. The graph in Fig. 2 illustrates the absence of a strong correlation between relative grain yield and test weight for two hybrids grown in our nitrogen rate trials over multiple site-years in Indiana.
Conventional dogma suggests that low test weight corn grain results in lower processor efficiency and quality of processed end-use products like corn starch, though the research literature does not consistently support this belief. Similarly, low test corn grain is often thought to be inferior for animal feed quality, though again the research literature is not in agreement on this. Whether or not low test weight grain is inferior to higher test weight grain may depend on the cause of the low test weight in the first place.
Common Causes of Low Test Weight Corn
So far this 2009 harvest season in Indiana, there are more reports of low test weight corn grain than good or above average test weights. There are primarily six factors that account for most of the low test weight grain in 2009 and four share a common overarching effect.
First and foremost, growers should understand that test weight and grain moisture are inversely related. The higher the grain moisture, the lower the test weight. As grain dries in the field or in the dryer, test weight naturally increases as long as kernel integrity remains intact. Test weight increases as grain dries partly because kernel volume tends to shrink with drying and so more kernels pack into a volume bushel and partly because drier grain is slicker which tends to encourage kernels to pack more tightly in a volume bushel.
Therefore in a year like 2009 with many of the initial harvest reports of grain moisture ranging from 25 to 30% instead of the usual starting moisture levels of about 20 to 23%, it should not be surprising that test weights are lower than expected. Hellevang (1995) offered a simple formula for estimating the increase in test weight with grain drying. In its simplest form, the equation is (A/B) x C; where A = 100 - dry moisture content, B = 100 - wet moisture content, and C = test weight at wet moisture content. The author does not say, but I suspect this simple formula is most applicable within a “normal” range of harvest moistures; up to moistures in the mid- to high 20’s.
Example: Dry moisture = 15%, Wet moisture = 25%, Test weight at 25% = 52 lbs/bu.
Test weight at 15% moisture = ((100 - 15) / (100 - 25)) x 52 = (85/75) x 52 = 58.9 lbs/bu
Secondly, thirdly, and fourthly; drought stress (primarily northern Indiana), late-season foliar leaf diseases (primarily gray leaf spot and northern corn leaf blight), and below normal temperatures throughout September all resulted in a significant deterioration of the crop’s photosynthetic machinery beginning in early to mid-September that “pulled the rug out from beneath” the successful completion of the grain filling period in some fields; resulting in less than optimum starch deposition in the kernels. Fifthly, early October frost/freeze damage to late-developing, immature fields resulted in leaf or whole plant death that effectively put an end to the grain-filling process with the same negative effect on test weight.
Finally, there were widespread reports of ear rots (diplodia, gibberella, etc.) throughout many areas of Indiana in 2009. Kernel damage by these fungal pathogens results in light-weight, chaffy grain that also results in low test weight diseased grain, broken kernels, and excessive levels of foreign material. This cause of low test weight grain obviously results in inferior (if not toxic) animal feed quality grain, unacceptable end-use processing consequences (ethanol yield, DDGS quality, starch yield and quality, etc.), and difficulties in storing the damaged grain without further deterioration.
Related References
Bradley, Carl. 2009. Diplodia Ear Rot Causing Problems in Corn Across the State. The Bulletin, Univ of Illinois Extension. [online]. <http://ipm.illinois.edu/bulletin/article.php?id=1233>. [URL accessed Oct 2009].
Hellevang, Kenneth. 1995. Grain Moisture Content Effects and Management. North Dakota State Extension Publication AE-905. [online]. <http://www.ag.ndsu.nodak.edu/abeng/pdffiles/ae905.pdf>. [URL accessed Oct 2009].
Hicks, D.R. and H.A. Cloud. 1991. Calculating Grain Weight Shrinkage in Corn Due to Mechanical Drying. Purdue Extension Publication NCH-61 [online]. <http://www.ces.purdue.edu/extmedia/nch/nch-61.html> [URL accessed Oct 2009].
Hill, Lowell D. 1990. Grain Grades and Standards: Historical Issues Shaping the Future. Univ. of Illinois Press, Champaign, IL.
Hurburgh, Charles and Roger Elmore. 2008. Corn Quality Issues in 2008 - Moisture and Test Weight. Integrated Crop Management News, Iowa State Univ. Extension. [online]. <http://www.extension.iastate.edu/CropNews/2008/1023hurburghrobertsonelmore1.htm>. [URL accessed Oct 2009].
Hurburgh, Charles and Roger Elmore. 2008. Corn Quality Issues in 2008 – Storage Management. Integrated Crop Management News, Iowa State Univ. Extension. [online]. <http://www.extension.iastate.edu/CropNews/2008/1023hurburghrobertson.htm>. [URL accessed Oct 2009].
Nafziger, Emerson. 2003. Test Weight and Yield: A Connection? The Bulletin, Univ of Illinois Extension. [online]. <http://ipm.illinois.edu/bulletin/pastpest/articles/200323h.html>. {URL accessed Oct 2009].
USDA-GIPSA. United States Standards for Corn. 1996. USDA Grain Inspection, Packers and Stockyards Administration (GIPSA). [online] <http://archive.gipsa.usda.gov/reference-library/standards/810corn.pdf>. [URL accessed Oct 2009].
Wise, Kiersten and Charles Woloshuk. 2009. Dealing With Diplodia Ear Rot. Pest & Crop Newsletter, Purdue Extension. [online]. <http://extension.entm.purdue.edu/pestcrop/2009/issue24/index.html>. [URL accessed Oct 2009].
![]()
Field Drydown of Mature Corn Grain - (Bob Nielsen)
- Weather conditions strongly influence in-field grain drydown.
- Plant characteristics can also influence in-field grain drydown.
- Early grain maturation usually means faster in-field grain drydown.
- Later grain maturation usually means slower in-field grain drydown.
Grain moisture content at harvest obviously influences growers’ cost of artificially drying the grain after harvest. An early drydown of the crop also facilitates early or at least timely harvest of the crop prior to the colder and, often, wetter conditions of late fall.
Kernel moisture content decreases as the kernel develops through the blister stage (~ 85% moisture), milk stage (~ 80% moisture), dough stage (~ 70% moisture), dent stage (~ 55% moisture), and finally physiological maturity (~ 30% moisture). Prior to physiological maturity, decreases in kernel moisture occur from a combination of actual water loss (evaporation) from the kernel plus the continued accumulation of kernel dry matter via the grain filling process. After physiological maturity, percent kernel moisture continues to decrease primarily due to water loss from the kernel.
Weather & Timing of Grain Maturation
Grain moisture loss in the field occurs at a fairly linear rate within a range of grain moisture content from about 40 percent down to 15 to 20 percent, and then tapers off to little or no additional moisture loss after that. The exact rate of field drying varies among hybrids and years. Figure 1 illustrates changes in grain moisture content over time for an adapted medium maturity hybrid grown in Indiana in 1992 (unusually cool fall) and 1994 (more typical fall temperatures).
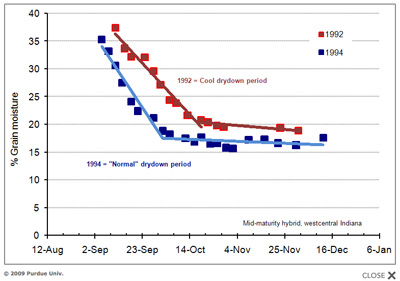
Fig. 1. Example of field drying progress of a mid-maturity corn hybrid in 2 years with different temperature patterns.
Field drying of mature corn grain is influenced primarily by weather factors, especially temperature and humidity/rainfall. Figure 2 illustrates the relationship between the average daily temperature during the drydown period and the rate of field drying. Simply put, warmer temperatures and lower humidity encourage rapid field drying of corn grain.
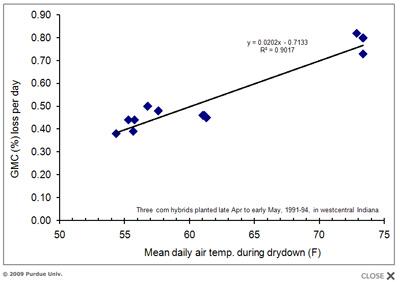
Fig. 2. Average daily grain moisture loss (percentage points/day) relative to average daily air temperature during the drydown period for three corn hybrids planted late April to early May, 1991-1994, west central Indiana.
Because grain drydown rates are greater when the drydown period is warmer, it stands to reason that a corn crop that matures in late August will dry down faster than one that matures in mid-September. In fact, there is a close relationship between the date when the grain nears physiological maturity (half-milkline or 2-3 weeks prior to kernel blacklayer) and the subsequent average daily drydown rate. Average daily drydown rates will range from about 0.8 percentage point per day for grain that nears maturity in late August to about 0.4 percentage point per day for grain that nears maturity in mid- to late September (Fig 3).
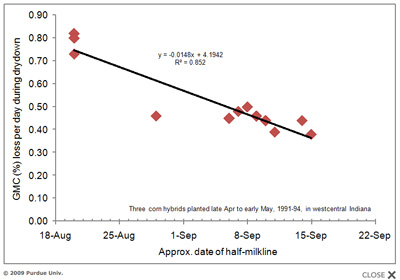
Fig. 3. Relationship between field drying rate and the date at which the grain nears maturity (half-milkline) for three corn hybrids planted late April to early May, 1991-1994, west central Indiana.
Bear in mind that grain moisture loss for any particular day may be quite high or low depending on the exact temperature, humidity, sunshine, or rain conditions that day. It is not unheard of for grain moisture to decline more than one percentage point per day for a period of days when conditions are warm, sunny, windy and dry. By the same token, there may be zero drydown on cool, cloudy, rainy days.
Hybrid Variability for Field Drying
Hybrid variability for the rate of grain moisture loss during post-maturity drydown and the eventual grain moisture content at harvest are of great interest to grower and seed industry alike. Growers desire hybrids with superior yielding ability (maximum gross income) that also dry very quickly in the fall (minimum drying or grain shrinkage costs).
The seed industry uses grain moisture content data to assign relative hybrid maturity ratings on the basis of relative moisture differences among hybrids at harvest. Two hybrids that differ by one “day” of relative maturity will typically vary by about one half percentage point of grain moisture content (an average daily loss of moisture) if planted and harvested on the same days. Recognize that relative hybrid maturity ratings are most consistent within, not among, seed companies.
When weather conditions are great for rapid grain drydown, hybrids tend to dry at fairly similar rates. When weather conditions are not favorable for rapid drydown, then hybrid characteristics that influence the rate of grain drying become more important.
Researchers have identified the following traits or characteristics as ones most likely to influence grain drying in the field. The relative importance of each trait varies throughout the duration of the field drydown process and, as mentioned earlier, is most influential when weather conditions are not conducive for rapid grain drying.
• Kernel Pericarp Characteristics. The pericarp is the outermost layer of a corn kernel (botanically; the ovary wall). Thinner or simply more permeable pericarp layers have been associated with faster drying rates in the field.
• Husk Leaf Number. The fewer the number of husk leaves, the more rapid the grain moisture loss. In fact, modern hybrids have fewer husk leaves than those commonly grown years ago.
• Husk Leaf Thickness. The thinner the husk leaves, the more rapid the grain moisture loss.
• Husk Leaf Senescence. The sooner the husk leaves senesce (die), the more rapid the grain moisture loss.
• Husk Coverage of the Ear. The less the husk covers the tip of the ear, the more rapid the grain moisture loss.
• Husk Tightness. The looser the husk covers the ear, the more rapid the grain moisture loss.
• Ear Declination. The sooner the ears drop from an upright position after grain maturation to a downward position, the more rapid the grain moisture loss. In particular, husks of upright ears can “capture” rainfall.
Final Trivia For Coffeeshop Conversations
Interestingly, there is little, if any, documented evidence that moisture loss occurs through the pedicel (kernel connection to the cob) of the kernel through the cob tissue. Post-maturity grain moisture loss occurs primarily by evaporative loss from the kernel itself. Research many years ago established that post-maturity moisture loss through the kernel connective tissues (placental tissues) back to the cob is essentially non-existent (Kiesselbach and Walker, 1952; Crane et. al., 1959). As those tissues cease to function (associated with the onset of kernel black layer and physiological maturity), the moisture and nutritional connection between kernel and cob is essentially broken.
Related References
Cavalieri, A.J. and O.S. Smith. 1985. Grain Filling and Field Drying of a Set of Maize Hybrids Released From 1930 to 1982. Crop Sci. 25:856-860.
Crane, P.L., S.R. Miles, and J.E. Newman. 1959. Factors Associated With Varietal Differences in Rate of Field Drying in Corn. Agron. J. 51:318-320.
Kiesselbach, T. A. and Elda R. Walker. 1952. Structure of Certain Specialized Tissue in the Kernel of Corn. Am J Bot 39:561-69
Nielsen, R.L. (Bob). 2008. Grain Fill Stages in Corn. Corny News Network, Purdue Univ. [online] <http://www.kingcorn.org/news/timeless/GrainFill.html> [URL accessed Sep 2009].
Troyer, A.F. and W.B. Ambrose. 1971. Plant Characteristics Affecting Field Drying Rate of Ear Corn. Crop Sci. 11:529-531.
2009 Post Harvest Training and Recertification Workshop – The 2009 Post Harvest Training and Recertification Workshop will be held on December 7, 2009 at the Beck Agricultural Center for Research and Education, 4540 U.S. 52 W., West Lafayette, IN. The complete brochure will be available soon. Watch our website at:<http://extension.entm.purdue.edu/grainlab/>.
We are still verifying some some session titles, but here is an overview of some of the sessions scheduled for this year:
• Aflatoxin Prevention & Mycotoxin Management
• Aeration and Quality Grain Management
• Sanitation vs. Fumigation: What Should Infleunce Your Decisions?
• Precision Fumigation of Grain and Structures
• Economic Factors Influencing Pest Management Decisions
• Transportation/Storage of Pesticides: Updates
![]()
Grain Drying and Storage for This Year’s Harvest - (Richard Stroshine and Matt Roberts, Agricultural and Biological Engineering)
Producers and elevator operators are facing unique challenges during the 2009 harvest season. Late spring plantings, and a cool summer combined with a wet and cool fall have led to unusually high harvest moistures for both corn and soybeans. Purdue Agriculture is responding to these challenges by enlisting the help of Mr. Matt Roberts, a Purdue graduate currently residing in Syracuse, Indiana. Matt will be answering technical questions regarding drying and storing this year’s crop. His goal is to help Indiana producers and the grain industry maintain the quality of their corn and soybean crops at the highest possible level. He can be reached via e-mail at mroberts@purdue.edu or by phone at (765) 494-1174. For more information on grain quality and issues related to this year’s harvest visit the Purdue Grain Quality web page at <http://extension.entm.purdue.edu/grainlab/>
![]()
The 2009 CCA Conference, December 15 & 16 – The Indiana Crop Adviser Conference will be hosted at the Indianapolis Marriott East, (800) 228-9290. A block of rooms has been reserved at a rate of $85.00 plus taxes / night single or double for December 14 and 15, 2009. Please let the hotel know you are with the Indiana Certified Crop Adviser Group. Reservations need to be made by November 30, 2009.
Don’t miss the 2009 Conference:
• Two-day format covered all four performance objectives for CCA, plus Professional Development.
• Maximum flexibility: participants can follow one track or choose multiple tracks; attend one day or two; most sessions offered twice.
• Nationally recognized speakers.
• All sessions in same area for easy rotation.
• CCAs can earn 16 CEUs at single event
• Indiana commercial pesticide applicators can earn up to 9 CCHs
• Conference Proceedings on CD
• Tuesday Evening Reception
• Network with CCAs, farmers, researchers, consultants and industry folks
• Each session equals 1 CEU
• Get a “jump” on winter meetings and consulting with timely information and data.
View more information about the conference and/or register at <http://indianacca.org>.
![]()