
Pest & Crop Newsletter, Entomology Extension, Purdue University
Bean Leaf Beetle Pod Feeding on Late Soybean - (John Obermeyer and Larry Bledsoe)
- Late maturing soybean may attract bean leaf beetle.
- Pod damage may result in poor seed quality.
- Green pods are more attractive than yellow ones.
- Management threshold depends on several factors.
Soybeans grown for seed, especially late-planted or late-maturing beans, should be monitored for bean leaf beetle damage as leaves begin to yellow and pods remain green. Bean leaf beetles scar the surface of pods, but only occasionally feed through the pod to the developing beans. During pod maturation, this scar often cracks leaving an entry hole for airborne plant pathogens that may cause discolored, moldy, shriveled, or diseased beans that show no outward signs of the pathogen.
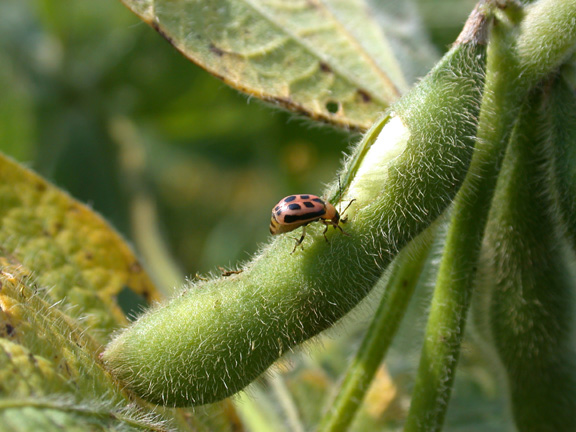
Bean leaf beetle feeding on pod
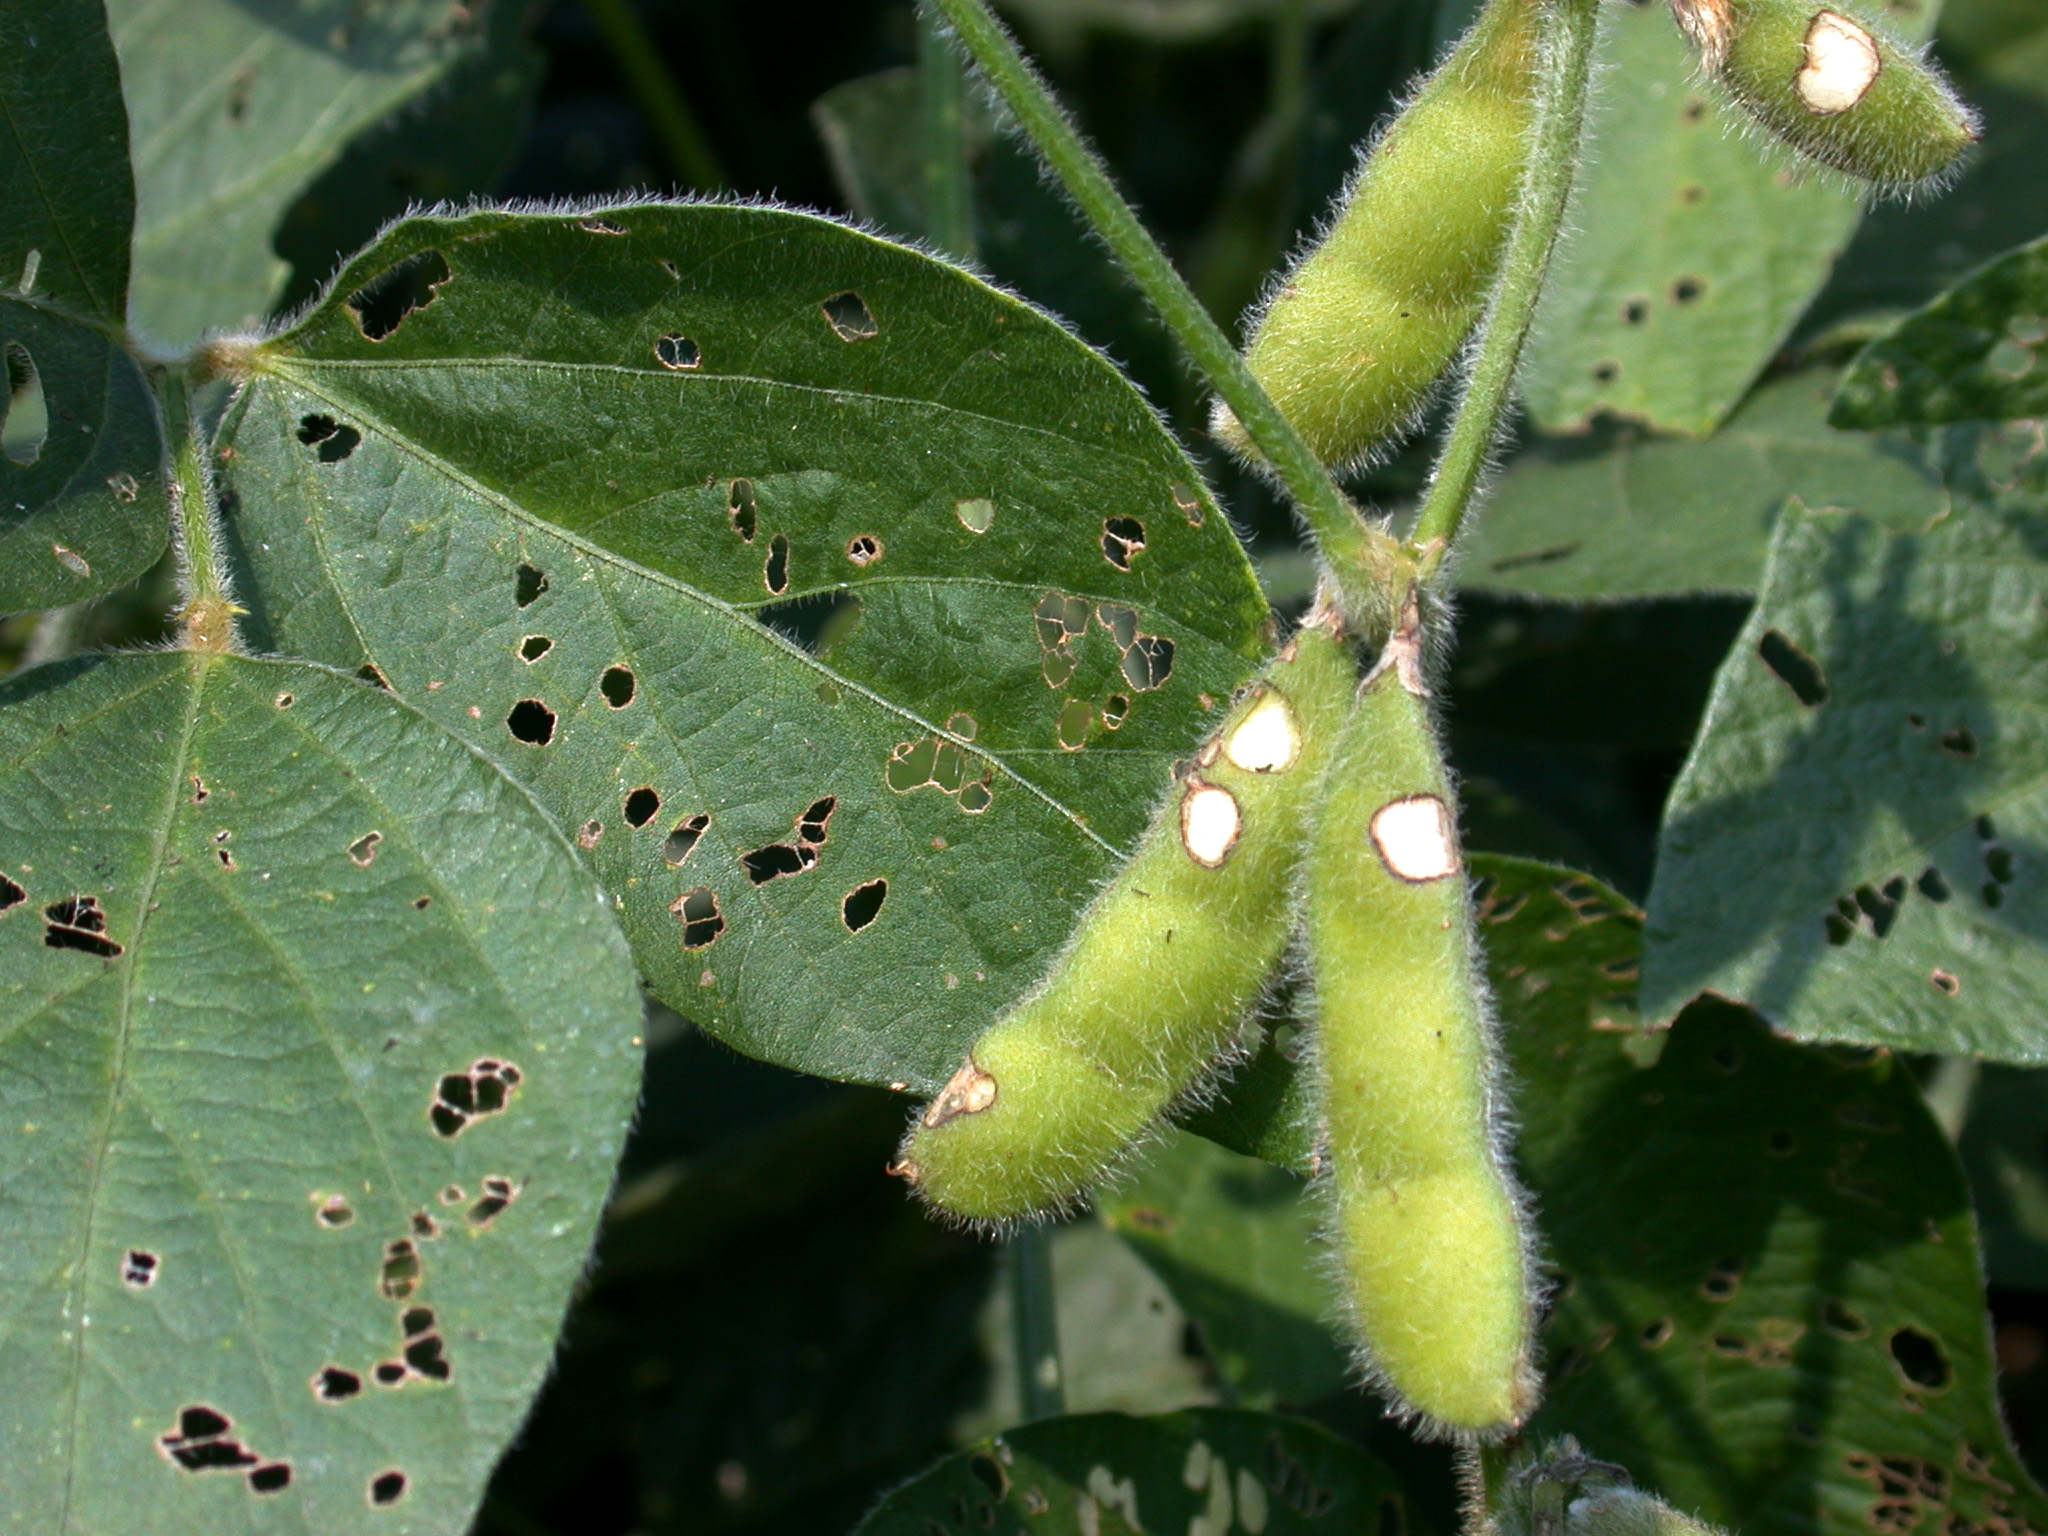
Scarred ods and leaf defoliation
It is important for pest managers to be able to predict whether economic damage will occur based on the types and numbers of beetles that are present and the stage of pod development (i.e., green, yellow, yellow-brown, or brown pods). Once the pods turn yellow to yellow-brown, they become less attractive and less susceptible to damage. Control is normally not warranted from this point on (see the following table).
Randomly select 2 plants in each of 5 areas of the field and count the number of pods per plant and the number that show damage (10 total plants). Calculate the percentage of damaged pods per plant for the field as a whole. Note if the pods are green, beginning to turn yellow, or are yellow/brown. Also determine the number of beetles per sweep using an insect sweep net. Take 5 sets of 20 sweeps in the field. Determine the number of bean leaf beetles per sweep. Additionally, note whether beetles are still actively feeding while surveying the field.
There has been considerable interest in bean leaf beetle and its association with bean pod mottle virus (BPMV). Bean leaf beetle is one of major beetle-vectors of this disease. They spread the virus by feeding on infected plants, ingesting the virus with plant tissue, and then regurgitating gut content after moving to and feeding on an uninfected plant. BPMV symptoms at harvest include green stem and hilum bleeding. Treatment for bean leaf beetle to reduce bean pod mottle virus this time of the year is not recommended, as most disease transmission occurs very early in the season.
Use the following table to determine when a treatment may be necessary.
Pod Injury Level |
No. Of Beetle Per Sweep In 30 Inch (7 Inch) Row Spacing |
||
Less Than 4(3) |
4(3) To 7(5) |
More Than 7(5) |
|
0 to 8% |
Discontinue sampling |
Sample again in 5 days |
Control (preventive) if pods still green |
8 to 12% |
Sample again in 5 days |
Control if pods are still green |
Control if pods are green to yellow |
Over 12% |
Control if pods are still green and beetles are present |
Control unless pods are completely dry |
Control unless pods are completely dry |
Table modified from the University of Illinois |
|||
![]()
Click here to view the Black Light Trap Catch Report
![]()
Ear and Stalk Rots Appearing in Indiana - (Kiersten Wise)
Reports of stalk rot and Diplodia ear rot have picked up across Indiana in the last week. Stalk rots may be problematic this year after the dry, stressful conditions during August. In Indiana, there are several diseases that can cause stalk rots. So far this year, anthracnose stalk rot has been the most widely reported cause of stalk rot. Anthracnose stalk rot is a common fungal disease caused by Colletotrichum graminicola. This disease causes yield losses from lodging and stalk breakage. Symptoms of anthracnose typically appear just prior to senescence, although symptom expression differs among hybrids. Lesions of anthracnose generally appear as long, narrow, brownish-black streaks or lesions on the surface of the stalk. Older lesions of anthracnose are darker and may be shiny in appearance and extend into the rind of the stalk (Figure 1). The internal tissues of the stalk, or pith, may also have brownish discoloration that will be hard to distinguish from other stalk rots (Figure 2). Anthracnose stalk rot can also occur above the ear. This infection may cause top dieback or top kill and result in lodging above the ear.
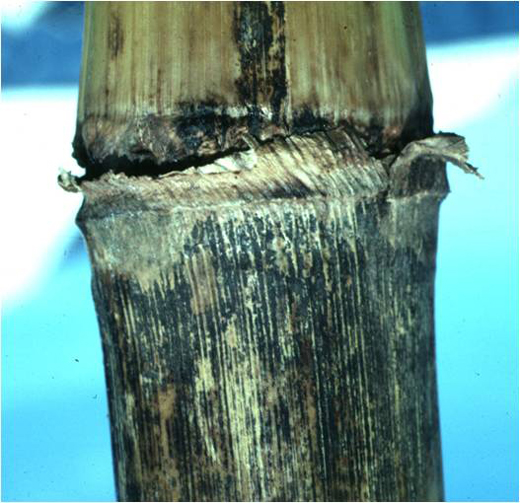
Figure 1. Symptoms of anthracnose stalk rot.
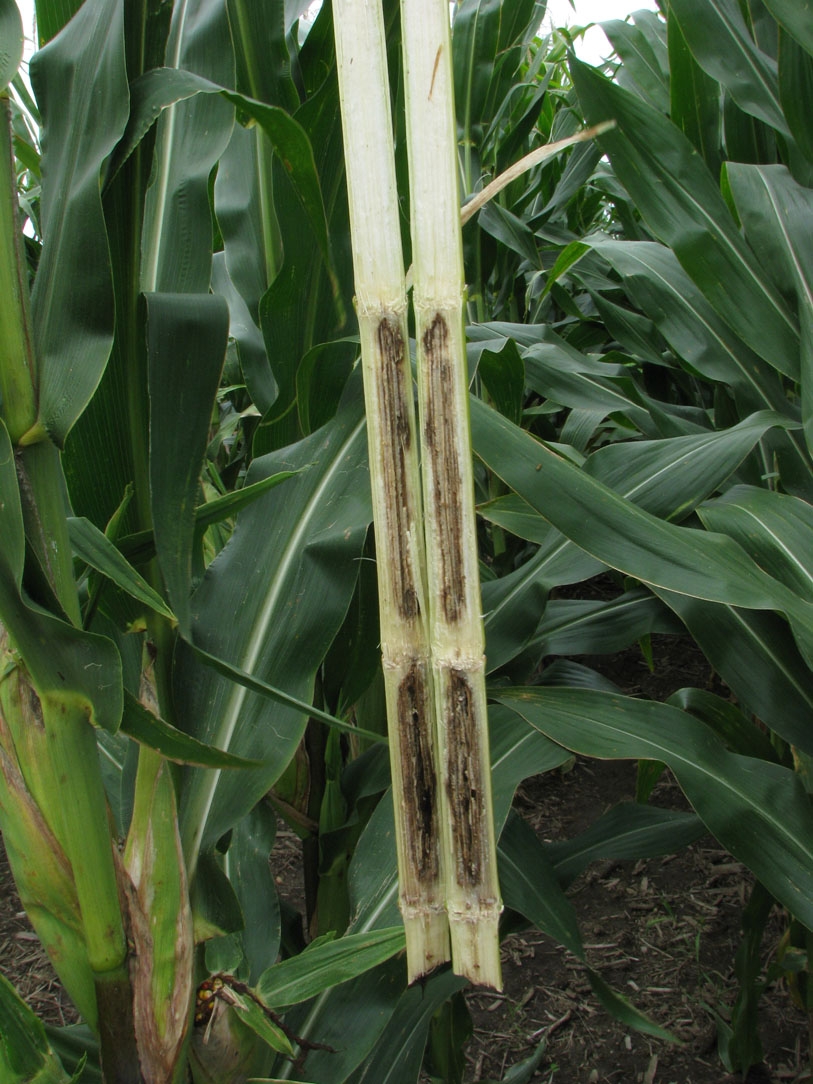
Figure 2. Internal discoloration and degradation of pith due to anthracnose stalk rot.
The fungus causing anthracnose stalk rot overwinters in infected crop residue, and the disease is more severe in corn-on-corn rotations. Resistant hybrids are available for use, and a combination of resistant hybrids and crop rotation is recommended to minimize losses due to this disease. Bob Nielsen provided a good overview on stalk rots last week in the Pest and Crop Newsletter in his article “Stress During Grain Fill: A Harbinger of Stalk Health Problems.” This article explains how to scout and manage fields with general stalk rot issues.
Diplodia ear rot has also been confirmed in Indiana. In this case, the fungus that causes ear rot (Stenocarpella maydis) also causes Diplodia stalk rot. The fungus can infect plants through the husk or the shank, and rot the husk before corn is fully mature. Bleached husks with white mold and tiny black specks called pycnidia are commonly observed on infected husks (Figure 3). White mold can also grow between the kernels and into the cob and cover the ear with fuzzy growth. This fungus does not produce toxins and is not hazardous to feed, although feeding value is reduced with infection. In susceptible hybrids, substantial yield losses can occur. The best management for this disease is to avoid planting susceptible hybrids, and avoid corn-on-corn rotations or planting into corn residue.
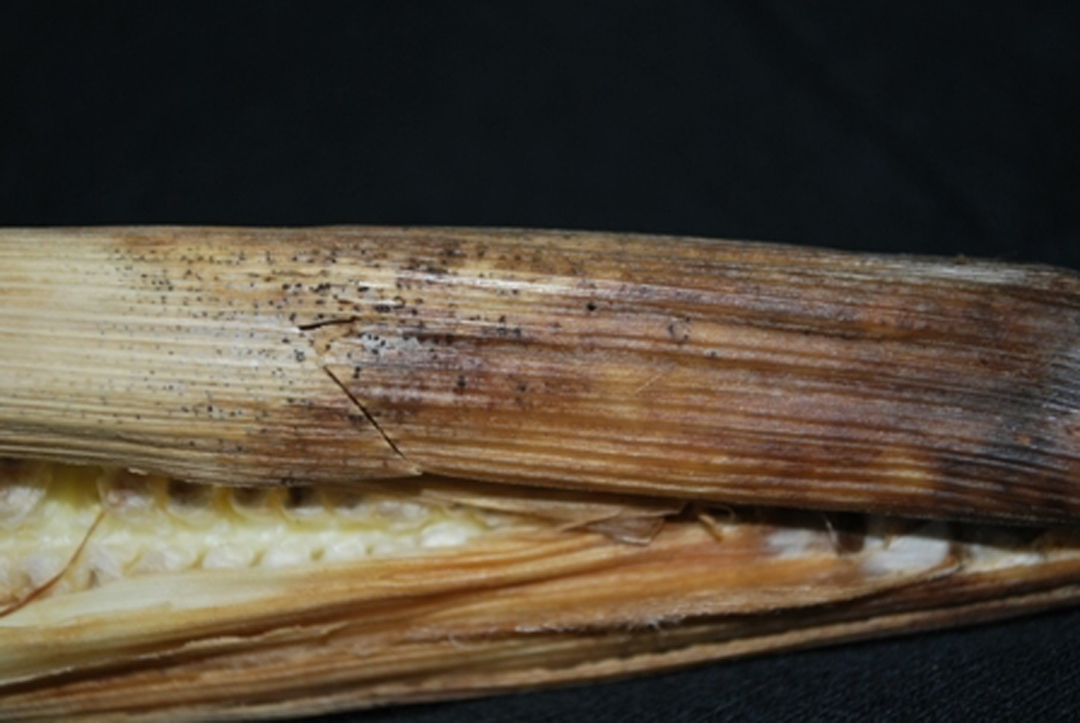
Figure 3. Corn husk infected with Diplodia ear rot.
Finally, a note on a “look-alike” issue that has caused some confusion this year…
Purple Leaf Sheath of corn, a non-infectious discoloration of leaf sheaths, has been reported throughout Indiana. The purpling observed on leaf sheaths has been mistaken for anthracnose stalk rot in several cases.
Purple leaf sheath is a harmless disorder that results when pollen or other debris become trapped in the leaf sheaths by the stalk. A variety of saprophytic fungi, bacteria, and yeast feed on the trapped pollen and the result is a purple to brown spot on the leaf sheath or stalk where the decomposition of the pollen is occurring (Figure 4). Saprophytic fungi can also grow within the dead tissue causing dark flecks that can confuse diagnosis (Figure 4). With this disorder, no discoloration is associated with the internal stalk tissue and no management is required.
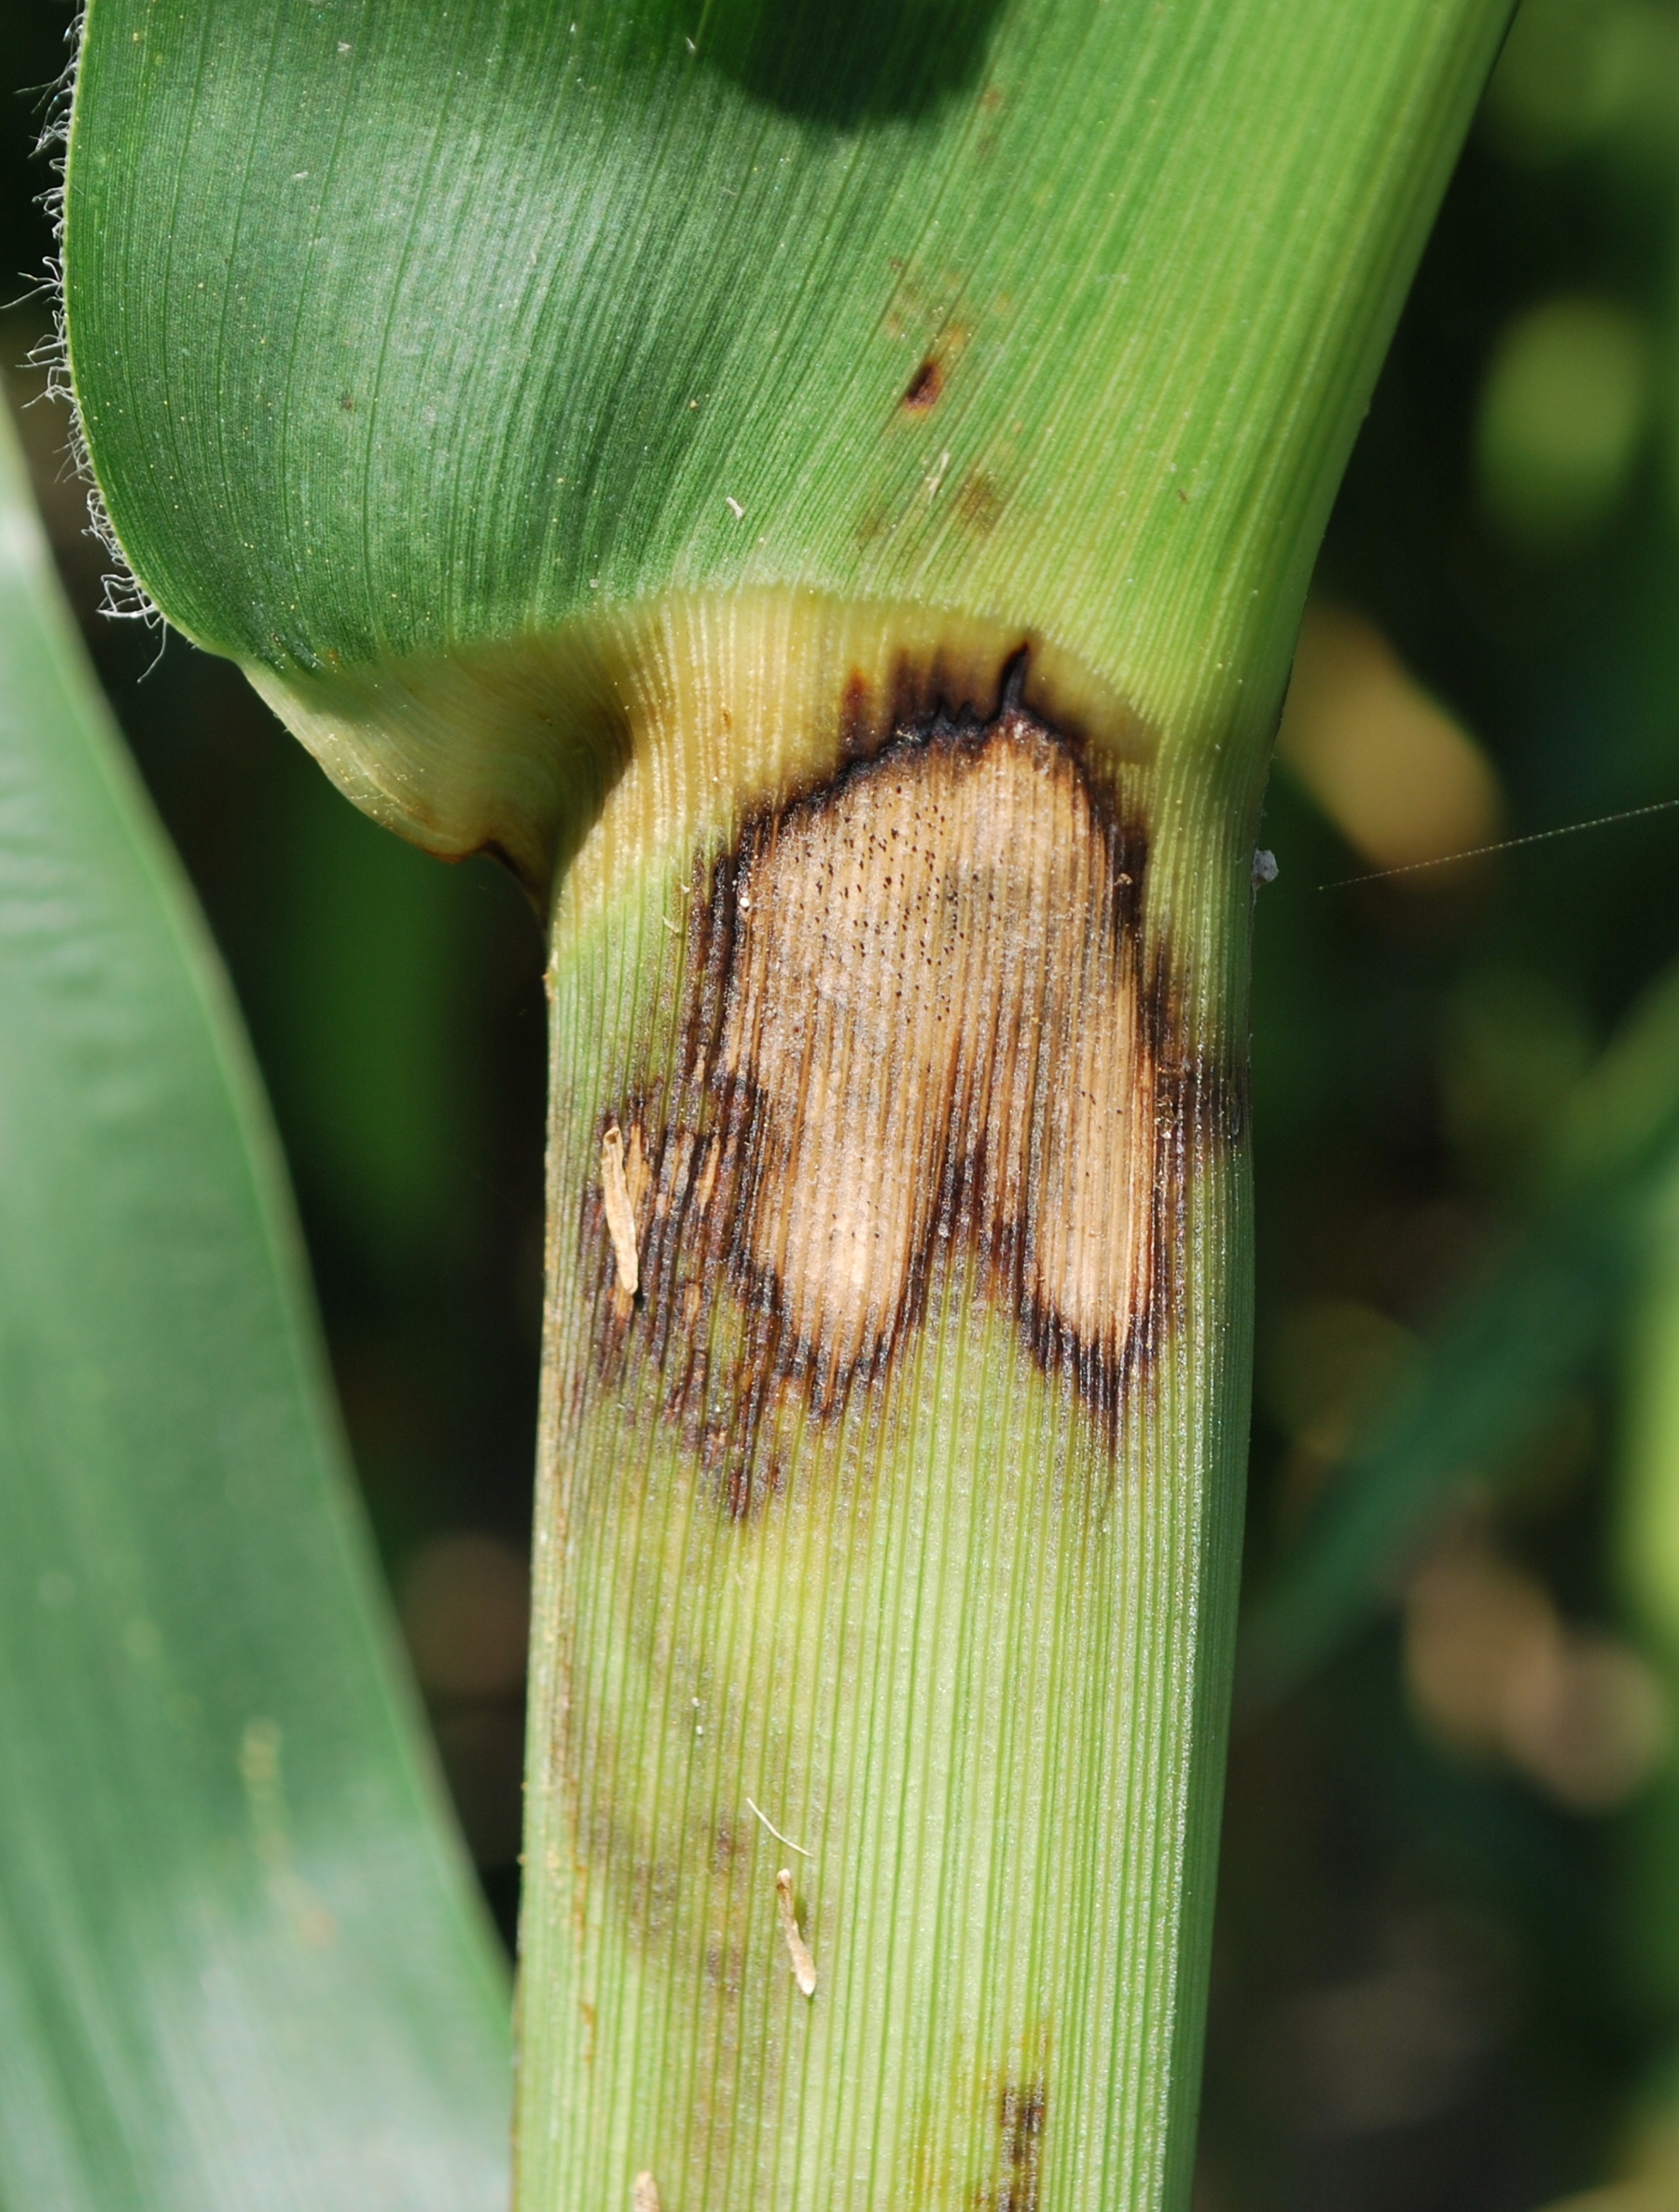
Figure 4. Purple leaf sheath on corn caused by pollen decay within the leaf sheath.
![]()
Yield Monitor Calibration: Garbage In, Garbage Out - (Bob Nielsen)
Grain yield monitors have been in vogue for more than 10 years and can provide valuable yield information to growers. Yield monitors offer a visual diversion from the boredom of harvest. They provide a source of historical yield records potentially more detailed than that offered by elevator weigh tickets. They provide a viable alternative to weigh wagons or farm scales for measuring yields in on-farm research trials. When connected to a DGPS receiver, yield monitors generate a source of geo-referenced yield data that can enable growers to document the extent of spatial yield variability within fields.
Most yield monitor systems operate on the same general principles. Typically, a grain flow impact sensor is located at the top of the clean grain elevator. Grain flow hits the impact sensor on its way to the loading auger. The impact of the grain flow is translated to electrical signals by the sensor. The electrical signal data are translated to estimates of grain flow rate by the yield monitor’s internal software. If equipped with a DGPS receiver, the yield monitor matches the individual yield estimate data points to geographic locations in the field.
Yield estimates on a whole field or individual load basis made by a well-calibrated yield monitor are accurate in the sense that they often very closely match yield estimates calculated from weigh wagons or commercial weigh scales. However, to achieve a satisfactory level of accuracy, yield monitors must be “trained” to correctly interpret the electrical signals generated by the impact sensor into estimates of grain flow rate . Some background information may help you better understand the nature of and importance of faithfully and regularly calibrating yield monitors.
Calibrating a yield monitor simply requires the harvest of individual “loads” of grain that represent a range of grain flow rates (i.e., a range of yield levels) expected in the field(s) to be harvested.The amount of grain required for each calibration “load” ranges from 3,000 to 6,000 lbs (50 to 100 bu grain) depending on the manufacturer’s recommendations for the specific model/make of yield monitor. The grain weight of each “load” is estimated by the yield monitor as the grain is harvested. The grain for that specific “load” is then offloaded from the combine hopper and weighed on weigh wagon or commercial scales. The actual weight is then entered into the yield monitor console and the yield monitor firmware makes adjustments to curve.
Conceptually, the calibration process is about fitting a response curve between grain flow rate and flow sensor signal strength in order to estimate low, medium, and high yields. Makes of monitors appear to differ in the nature of the calibration curve that is determined.
Some manufacturers suggest that only one grain load is necessary to perform an accurate calibration. The need for only one grain load implies that the calibration response curve is a straight-line or near-linear relationship between grain flow rates and flow sensor signals. While the standard recommendation is for only one grain load, the “fine print” in the owners’ manual suggests that additional calibration loads may be added to fine-tune the accuracy when necessary.
Other manufacturers recommend between 3 and 6 grain loads to perform a satisfactory calibration of the yield monitor. This suggests that the calibration response curve for these yield monitors is not a straight-line, but is rather some sort of non-linear response curve that requires a number of calibration points to best “train” the yield monitor how to interpret the flow sensor signals.
The goal here is to “capture” the full range of grain flow rates (aka yield levels) you expect to encounter during the harvest of your fields. Capturing a range of grain flow rates can be a nuisance because it typically requires harvesting individual full header width “loads” at different speeds or partial header width “loads” at a constant speed. This headache plus the time it takes to off-load and weigh the individual grain loads are among the most common reasons why growers do not faithfully calibrate their yield monitors.
Yield monitor accuracy can be excellent if well-calibrated. Yield estimates by calibrated yield monitors that I use in my field-scale research trials are typically within 1 % of the actual grain weight measured with a weigh wagon or farm scales. Conversely, yield estimates can be very poor if yield monitors are not well-calibrated. The error in accuracy can be as much as 100 % if the yield monitor is taken “off the shelf” and put into service without any calibration. Errors in accuracy can easily range as high as 7 to 10 % late in harvest season if the yield monitor was calibrated only at the beginning of the harvest season. Errors in yield estimates are especially likely if the full anticipated range of harvested grain flow rates are not included in the calibration of the yield monitor.
Well, you may ask... who cares whether or not your yield monitor is providing you with accurate yield estimates. After all, growers are typically paid at the point of sale according to the weights printed on the scale ticket and not according to a yield map. Quite honestly, it also may not matter for simple farm record-keeping purposes.
However, if you want to USE the information that an accurate yield dataset provides, then you should strive to ensure accuracy in the yield estimates made by your yield monitor. Common uses for yield monitor data include comparisons of one field to another, one specific spot in a field to another, one hybrid’s performance to another, early versus late harvest season, and experimental treatments in on-farm field trials.
Yield monitor calibration accuracy can be influenced by yield levels outside the range of grain flow rates used for the yield monitor calibration, by seasonal changes in temperature, by grain moisture content early in the season versus late in the season, by hybrids in terms of their differences for grain weight, grain shape, and grain moisture, and by field topography. Calibrating your yield monitor once a season will typically not be satisfactory. Check the accuracy of the yield monitor calibration occasionally by harvesting and weighing additional calibration loads. Recalibrate the yield monitor when necessary to maintain an acceptable accuracy.
Don’t forget to...
• Also calibrate the combine’s grain moisture sensor.
• Also calibrate for the zero-flow combine vibration.
• Also calibrate the temperature sensor at the beginning of the season.
• Re-read the yield monitor operations manual prior to the harvest season.
• Create a pre-season and in-season yield monitor checklist of all adjustments and settings.
• Go through the yield monitor checklist every morning before beginning the day’s harvest.
Bottom Line
Yield data can be very useful for identifying and diagnosing yield influencing factors in corn or soybean. Yield monitors can also be useful for harvesting on-farm research trials. Yield monitor calibration, yield data processing, and yield data “cleaning” are necessary to ensure accurate yield data. Remember the old adage: “Garbage in….Garbage out”.
Related References
Grisso, Robert, Mark Alley, and Phil McClellan. 2003. Precision Farming Tools: Yield Monitor. Virginia Cooperative Extension Pub 442-502. [On-line]. Available at <http://www.ext.vt.edu/pubs/bse/442-502/442-502.pdf> [URL accessed 9/4/08].
Shearer, S.A., J.P. Fulton, S.G. McNeill, S.F. Higgins, and T.G. Mueller. 1999. Univ. of Kentucky. [On-line]. Available at <http://www.bae.uky.edu/precag/PrecisionAg/Exten_pubs/pa1.pdf>. [URL accessed 9/4/08].
Watermeier, Nathan. 2004. Yield Monitor Calibration Tips—Making The Most From Your Data. Ohio State Univ. Extension Pub ANR-8-04. [On-line]. Available at <http://ohioline.osu.edu/anr-fact/pdf/0008.pdf>. [URL accessed 9/4/08].
![]()