
Pest & Crop Newsletter, Entomology Extension, Purdue University
- Tips for Staging Corn with Severe Leaf Damage
- Use Thermal Time to Predict Leaf Stage Development in Corn
- Determining Corn Leaf Stages
- Heat Unit Concepts Related to Corn Development
Protecting Refuge Acres from Rootworm Damage – (Christian Krupke, John Obermeyer, and Larry Bledsoe)
• Planting of refuge with Bt-Rootworm corn is necessary and crucial to prevent resistance.
• Misinformation and creativity abound concerning refuge acres.
• Protecting refuge acres from rootworm feeding can be a challenge, especially in high-risk rootworm damage areas.
Sales of Bt-Rootworm corn have skyrocketed in recent years. Hopefully all who are utilizing this technology for rootworm protection understand and will implement EPA’s mandated refuge. This is important for 2 reasons: First, it is the law. Second, not using refuges could have disastrous consequences in the long-term for growers, due to resistance. The refuge is crucial to preserve the longevity of this technology. There are few guarantees in agriculture, but one is that insects will always evolve and adapt to counteract whatever we throw at them. The other guarantee is that once resistance occurs, it will be on commercial farms, not in research plots or laboratories.
The refuge must comprise 20% of the production field where Bt corn is used. The 80/20 arrangement of the field is quite flexible. Options include planting the refuge in blocks, strips throughout, or end rows all are acceptable as long as it equals or exceeds 20% of the field’s total acreage. The idea behind each of these arrangements is that beetles emerging from Bt-Rootworm corn will mate with beetles from the refuge. We are conducting research currently to determine the rates that beetles actually move and mate within each refuge, in an attempt to discover the “best” refuge.
Protecting refuge corn from rootworm feeding has presented some challenges for producers. They have shared a wide range of thoughts on this from providing no protection for the refuge, to mixing Bt and refuge seed in the seed boxes, and mounting insecticide boxes that may or may not be approved by the equipment manufacturer. In moderate to high pressure areas, 20% of a field is worth protecting from the rootworm’s potentially devastating damage. Mixing Bt and refuge need is not allowed or recommended at the present time. Since the refuge seed will have no protection, and eggs will be distributed throughout the field, the 20% unprotected seed will be subject to high pressure and damage. This “refuge-in-a-bag” approach does have merit however, if we can find an efficacious way to protect the refuge seed. This is the challenge ahead.
Therefore we are left with planting and protecting the refuge separately from the rest of the field. This entails using granular, liquid or seed-applied insecticides. The newer John Deere planters have eliminated granular insecticide units, although they can be “plumbed” for liquid soil insecticides. Some of these planters have been successfully retrofitted with SmartBox® systems that fall within the manufacturer’s weight tolerances. Splitting the planter with Cruiser Rootworm or Poncho 1250 seed-applied insecticides is possible with planters that have row seed boxes, but may not be possible with bulk seed boxes. Also, it should be mentioned that low rates of the seed-applied insecticides (Poncho 250, for example) do NOT control rootworms. Rootworm product efficacy should be considered depending of the anticipated risk to damage. Refer to Pest&Crop #1, March 2, 2007 <http://www.entm.purdue.edu/extension/pestcrop/2007/index.html>. Note that in general, liquid soil insecticides and seed-applied insecticides perform poorly under high rootworm pressure. Granular insecticides are still the best bet to protect a refuge that is under high pressure.
Should the refuge remain untreated at planting time and damage is anticipated or noticed, rescue treatments are still a possibility. Liquid insecticides (i.e., Furadan, Lorsban) can be applied at post-emergence or cultivation-time. Obviously planting the refuge in a block design that is well marked will help in treating the unprotected corn. Shortly before rootworm egg-hatch, about the third week of May, drop nozzles should be directed toward the base of the corn plants with the labeled rate of insecticide. Following-up with cultivation will incorporate the insecticide and promote the establishment of brace roots. Weather is often a limiting factor in getting postemergence insecticides applied in a timely manner.
![]()
Aphids In Freeze-Damaged Wheat - (John Obermeyer, Christian Krupke, and Larry Bledsoe)
• Aphids observed in some Indiana wheat.
• Virus transmission by aphids occurs mainly in the fall.
• Watch for aphids accumulating on wheat heads later in spring.
While out inspecting freeze-damaged wheat, some have noticed aphids on the sickly looking plants. Actually, the presence of aphids is common every spring but more people are out looking this year. Though the wheat may be stressed from freeze damage, scattered aphids feeding contribute little, if anything, to yield losses. In addition, aphids at this time aren’t likely to infect and spread Barley Yellow Dwarf Virus (BYDV). Plants infested with aphids in the fall are more likely to be infected with BYDV and possibly severely damaged. Insecticide applications applied after wheat reaches Feekes growth stage 4.0 does little good to prevent the transmission of BYD (refer to “Feekes Growth Stages for Wheat” in Pest&Crop, #3, April 13, 2007). In short, there is little justification to treat aphids at this time.
However, aphid populations may increase as wheat heads begin to emerge and fill. The aphids can injure developing heads by sucking plant juices. An average of 50 or more aphids per head indicates that an insecticide treatment should be considered. Normally when aphid numbers build to 10 or more per plant, aphid predators and parasites increase rapidly in response to this food source. Lady beetles (adults and larvae), syrphid fly larvae, lacewing larvae, and several species of parasites will soon be scouring fields for aphids. In Indiana, because of a reduced virus threat and the natural enemies, the necessity to treat for aphids in the spring is rare.
![]()
![]()

![]()
Black Cutworm Moths Trickle In - (John Obermeyer and Christian Krupke)
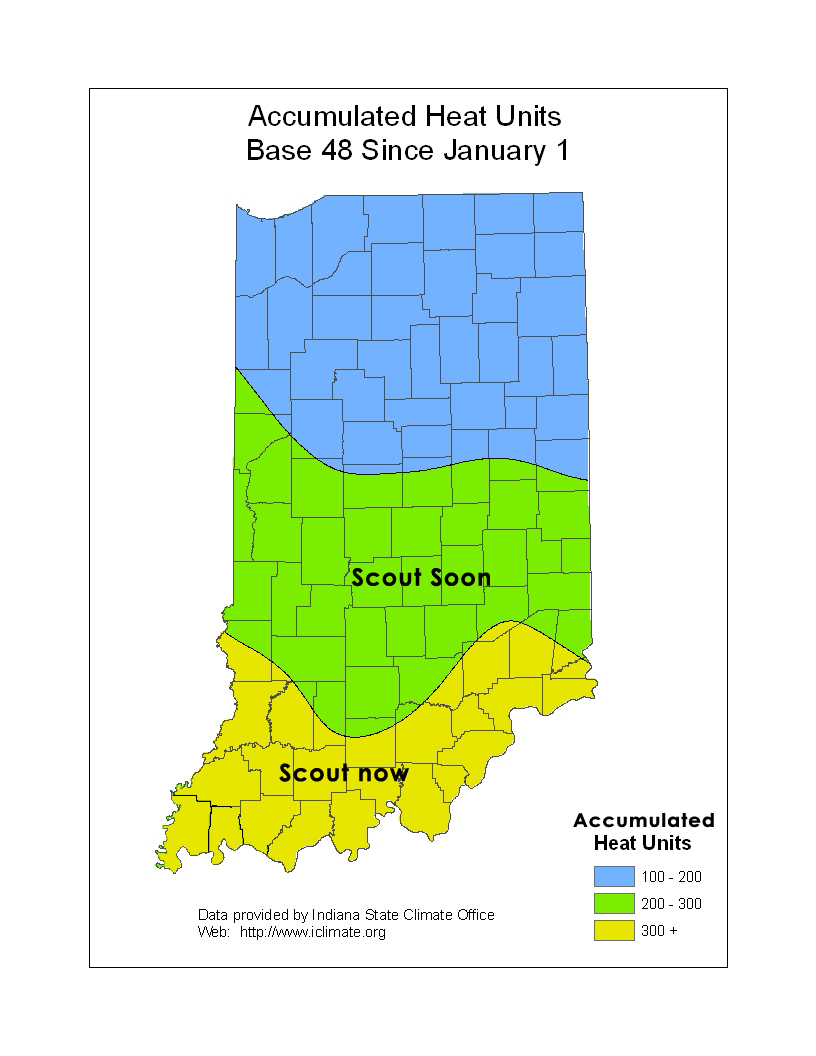
The lack of storm fronts from the Southwest the last week has slowed the arrival of black cutworm moths into the state. We appreciate the diligence of the pheromone trap cooperators, especially as we enter the next few weeks, which typically yields intensive moth captures. That is when we begin to track heat unit accumulations for larval development and potentially cutting of the season’s corn. Stay tuned, they are coming!
![]()
Click here to view the Black Cutworm Pheromone Trap Report
![]()
Nematode Updates 2007: Soybean Cyst Nematode - (Jamal Faghihi, Christian Krupke and Virginia Ferris)
Soybean planting is just around the corner. Numerous surveys in Indiana and elsewhere have identified soybean cyst nematode (SCN) as the most prevalent pest of soybean, and its mere presence exacerbates other pest problems. Even so, we have had a drastic reduction in numbers of samples received in our laboratory for SCN analysis in the last year. This is true also for other diagnostic laboratories in the Midwest. Growers may have a false sense that their problems with SCN have been resolved with resistant cultivars. It is possible that field populations of SCN in Indiana might be changing in ways that render the most common source of resistance to SCN (PI 88788) less effective. Other researchers in the region have reported similar trends.
With funding from the North Central Soybean Research Program we have started a large survey among three States and a Canadian province. These locations were chosen based on the number of years that varieties with PI 88788 have been grown. The preliminary results indicated that there might be a correlation between numbers of SCN populations that can overcome PI 88788 resistance and the length of time these resistant varieties have been used. Our research and that of others has shown that SCN continues to remain an elusive pest that requires constant monitoring and continual testing.
Why is further SCN soil testing needed when it is already known to be present? Soil tests are the only accurate way you can find out whether a SCN population number is changing and if a resistant variety is still working. Growers need to understand that genetic shifts in SCN populations are gradual and should not wait for yield losses before determining that a change in the SCN population has occurred. About two months after planting, where SCN presence has been previously confirmed, inspect for the tiny white and yellow SCN females on the roots. Or send soil plus root samples in the middle of the growing season to a nematology laboratory to determine the effectiveness of resistant varieties growing in the field. If race determination has been performed for a field population in the past, you might want to repeat the test after about four soybean crops to measure any possible changes. If no race profile exists for a field, one needs to be established so future comparisons are possible. In other words, planting SCN resistant varieties is not the final solution to the SCN problem. The management of this pest is an ongoing and dynamic one that requires constant vigilance.
Soybean seed selection has already been established for this season. If you have had problems with SCN in the past, you probably have chosen one or more of the “cyst-bean” cultivars to plant. We provide a service to determine the degree of its resistance in your field. Send us about a gallon of your infested field soil and about 100 seeds from each cultivar that you are planning on planting in that field. We will expose those seeds to nematodes extracted from your field soil and provide you with the resistance data. If we find enough nematodes in the soil that you provide, this process will take about 6 weeks to complete and cost about $50 for up to five cultivars. We charge $10/each additional cultivar. We still perform the race test, which costs $50/test. If we don’t find enough nematodes in your field sample, we have to increase them in the greenhouse. This additional task will add another 6 weeks time to the process and add $20 cost/sample. We include PI 88788, CystX and Williams 82 (susceptible) as checks with no additional cost to you.
The best way to manage SCN over the years is to monitor your populations by sampling each field at least every four years. You can sample the soil anytime of the year and get an accurate understanding of the cyst population. This is a very crucial step in SCN management and should not be neglected. We provide this service to soybean growers at the cost of $10/sample, for which the submitter will receive a bill unless we are instructed otherwise.
If you have any questions about SCN or any other kinds of plant parasitic nematodes, you can contact Jamal Faghihi at 765-494-5901 or send an email to jamal@purdue.edu. Soil samples for nematode analysis can be sent to: Nematology laboratory, Purdue University, Department of Entomology, Smith Hall, 901 W. State Street, West Lafayette, IN 47907-2089.
Tips for Staging Corn with Severe Leaf Damage - (Bob Nielsen)
It is not uncommon for young corn plants to suffer severe leaf damage from frost, freezing temperatures, or hail. Such weather-related events usually leads to debate in the local coffee shops as to how to identify the age of a corn plant that has recovered from rather severe leaf damage.
Some may wonder why this topic is worthy of vigorous debate. The reason lies with the fact that a number of post-emergence corn herbicides can only be applied to corn up to a label-specified leaf stage (Loux et. al., 2007). Growers and applicators obviously need to be able to accurately stage corn plants, even if damaged, to determine whether application of a such herbicides will still be within label restrictions.
Unfortunately, dead leaf tissue does not resurrect itself and will eventually slough off as the plants continue to grow. The hotly debated question is whether the leaf stage of a recovered plant begins anew with the healthy leaves or whether the dead leaves (which may no longer be visible) should be counted. In other words, should a 5-leaf plant that has lost four leaves to frost injury now be considered a 1-leaf plant?
The simple answer is: A 5-leaf plant is a 5-leaf plant no matter how many lower leaves are damaged, dead, or otherwise missing. As long as the dead lower leaves remain attached to the plants, leaf staging is reasonably simple. Count the dead leaves and any additional ones with visible leaf collars (Nielsen, 2007a).
The challenge occurs when the dead lower leaves slough off and decompose or blow away. Now how do you count leaves if you are not sure whether the lowermost remaining leaf is #2 or #3? This problem is easily solved when staging V7 or older corn because one can then split stalks to identify the 5th node and its respective attached leaf (Nielsen, 2007a). Because stalk development is essentially nil for corn plants V5 or younger, this strategy for staging corn does not work for younger plants.
Here are two alternatives for staging damaged young corn:
1) Walk damaged and recovering fields soon while dead lower leaves of damaged plants are still attached. Mark ten consecutive plants with plot flags or garden stakes. Identify & record the leaf number of the lowermost healthy leaf (one likely to remain attached for some time) of each plant. Mark each such leaf by simply ripping off a third or half of the leaf. To simplify future leaf staging, mark the same leaf number on each of the 10 consecutive plants. When you come back in a week or later to stage the plants again, find the marked leaf on each plant and continue counting the number of leaves with visible leaf collars.
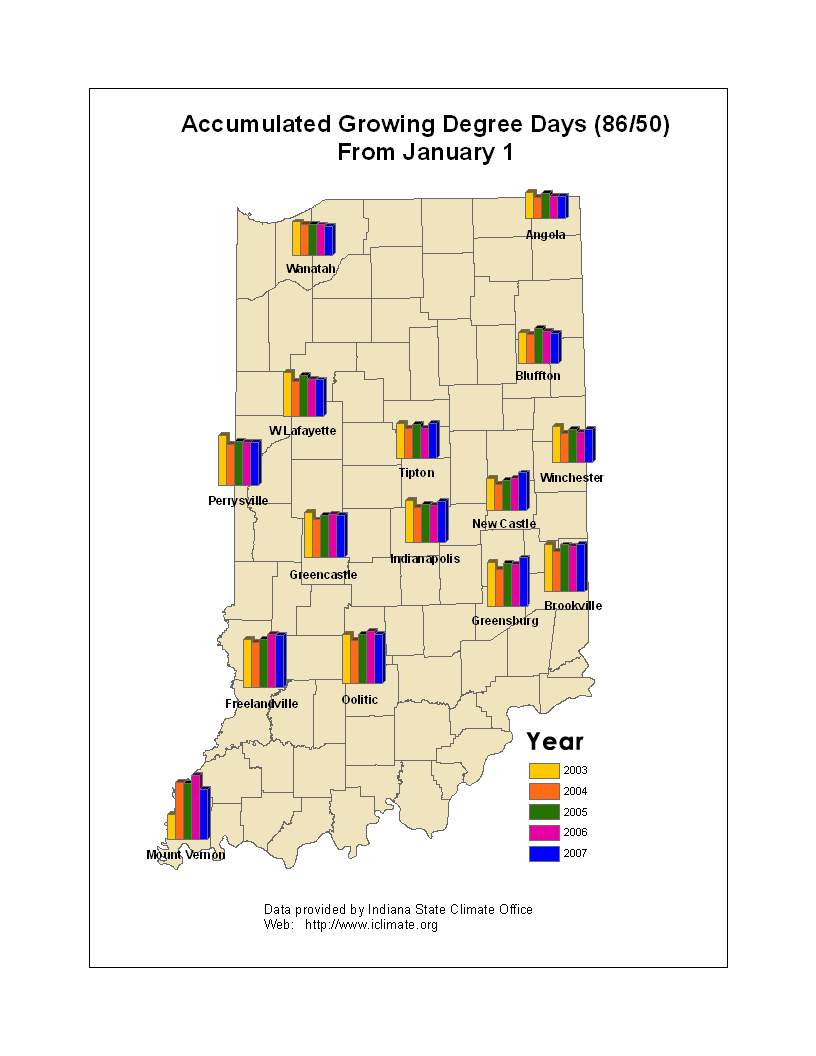
2) Predict leaf stage development based on thermal time (growing degree days or GDDs) from planting or emergence (Nielsen, 2007c). The relationship between corn development and temperature is reasonably strong. Emergence requires about 120 GDDs from planting and leaf collar emergence (up to about leaf #10) requires about 80 GDDs per leaf. Current year GDD data for various areas of Indiana are available online at the Indiana Climate Page <http://agmetx.agry.purdue.edu/sc.obs-geog.html>.

V3 corn seedling with lower leaves damaged by frost/freeze
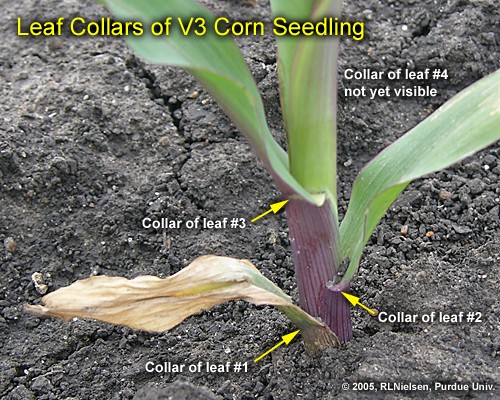
Closer view of leaf collars of damaged V3 seedling

V3 corn seedling with lower leaves damaged by frost/freeze
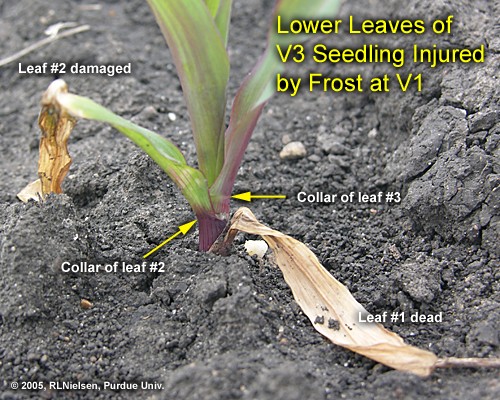
Closer view of leaf collars of damaged V3 seedling
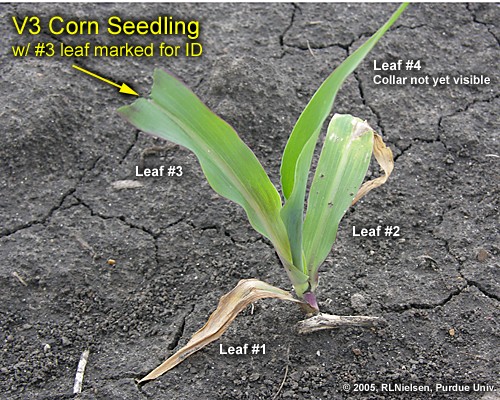
V3 corn seedling with #3 leaf marked for future leaf staging assistance
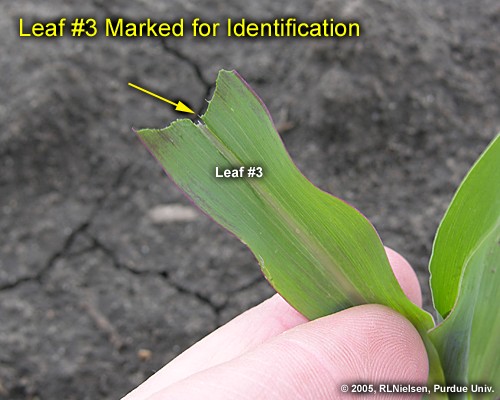
Leaf #3 marked by simply ripping off upper third of leaf
Related References
Loux, Mark, Jeff Stachler, Bill Johnson, Glenn Nice, & Tom Bauman. 2007. 2007 Weed Control Guide for Ohio and Indiana (WS-16). Table 7: Rainfast Intervals, Spray Additives, and Maximum Crop Size for Postemergence Corn Herbicides. Purdue Univ. & Ohio State Univ. Coop. Ext. Services. [On-Line]. Available at <http://www.btny.purdue.edu/Pubs/WS/WS-16/CornRainfast.pdf> (URL verified 4/16/07).
Nielsen, R.L. (Bob). 2007a. Determining Corn Leaf Stages. [On-Line]. Corny News Network, Purdue Univ. [On-Line]. Available at <http://www.kingcorn.org/news/timeless/VStageMethods.html> (URL verified 4/16/07).
Nielsen, R.L. (Bob). 2007b. Heat Unit Concepts Related to Corn Development. Corny News Network, Purdue Univ. [On-Line]. Available at <http://www.kingcorn.org/news/timeless/HeatUnits.html>. (URL verified 4/16/07).
Nielsen, R.L. (Bob). 2007c. Use Thermal Time to Predict Leaf Stage Development in Corn. Corny News Network, Purdue Univ. [On-Line]. Available at <http://www.kingcorn.org/news/timeless/VStagePrediction.html>. (URL verified 4/16/07).
![]()
Use Thermal Time to Predict Leaf Stage Development in Corn – (Bob Nielsen)
Being able to predict when a field of corn will reach particular leaf stages can be useful for scheduling post-emergence applications of certain herbicides and sidedress N fertilizer, especially if your farming operation is so large that regular field inspections are difficult to work into your busy schedule. Leaf stage can be predicted on the basis of heat unit accumulation (aka growing degree days) from planting to the date in question.
Review of Concepts. For a refresher on how corn leaf staging is done, read my article “Determining Corn Leaf Stages” (Nielsen, 2004a). Another topic that probably needs reviewing is the concept of heat units (HUs) or growing degree days (GDDs). The concept is important because corn phenology is very dependent on temperature. Heat unit or GDD calculation for corn phenology is described in another accompanying article “Heat Unit Concepts Related to Corn Development (Nielsen, 2004b).
Predicting Corn Phenology. Given an understanding of corn leaf stage development and heat unit calculation, you can predict the leaf stage of development for a particular field given its planting date and temperatures since planting. It is useful if you know when the crop emerged, but if not you can estimate that event also. Corn emergence typically requires about 120 GDDs from planting.
We know that corn leaf development rates can be accurately described by two linear response curves (Wuethrich, 1997). From emergence to leaf stage V10 (ten visible leaf collars), leaf collar emergence occurs at about one leaf every 80 GDDs (Wuethrich’s data suggested 85 GDDs, but plot data since suggests closer to 80 GDDs). From leaf stage V10 to the final leaf, leaf collar emergence occurs more rapidly at approximately one leaf every 50 GDDs.
Example 1: A field was planted on April 28 and emerged on May 5. Since May 5, approximately 535 GDDs have accumulated. Based on our research data, the estimated leaf stage for the crop (without looking at the field, mind you) would be between V6 and V7 (6 leaves x 80 GDDs = 480 GDDs; 7 leaves x 80 GDDs = 560 GDDs).
Example 2: A field was planted on April 28, but you do not know exactly when it emerged. Since planting, approximately 785 GDDs have accumulated. If you assume that the crop emerged in about 120 GDDs, then the estimated leaf stage for the crop would be about V8. This estimate is calculated by first subtracting 120 from 785 to account for the estimated thermal time to emergence, then dividing the result (665) by 80 (equal to 8.3).
Example 3: A field was planted on April 28 and emerged on May 5. Since May 5, approximately 1200 GDDs have accumulated. Your familiarity with these calculations tells you that the crop is likely beyond V10 (equal to 10 x 80 or 800 GDDs since emergence). So, first subtract 800 from 1200 (knowing the crop is at least at V10). Divide the result (400) by 50 to equal 8 additional leaves; for a total estimated leaf stage of V18.
Keep in mind that estimates of leaf stage development are only that, estimates. One of the factors that most influences the accuracy of these estimates is the existence or not of other growth-limiting stresses. Severe plant stress will generally retard stem and leaf sheath elongation, thus delaying the appearance of leaf collars. However, what I have described here will put you in the proverbial ballpark in determining which fields are at which leaf stages on a given day.
Related References:
Loux, Mark, Jeff Stachler, Bill Johnson, Glenn Nice, & Tom Bauman. 2007. 2007 Weed Control Guide for Ohio and Indiana (WS-16). Table 7: Rainfast Intervals, Spray Additives, and Maximum Crop Size for Postemergence Corn Herbicides. Purdue Univ. & Ohio State Univ. Coop. Ext. Services. [On-Line]. Available at <http://www.btny.purdue.edu/Pubs/WS/WS-16/CornRainfast.pdf>. (URL verified 4/16/07).
Nielsen, R.L. (Bob). 2007a. Determining Corn Leaf Stages. [On-Line]. Corny News Network, Purdue Univ. [On-Line]. Available at <http://www.kingcorn.org/news/timeless/VStageMethods.html> (URL verified 4/16/07).
Nielsen, R.L. (Bob). 2007b. Heat Unit Concepts Related to Corn Development. Corny News Network, Purdue Univ. [On-Line]. Available at <http://www.kingcorn.org/news/timeless/HeatUnits.html>. (URL verified 4/16/07).
Purdue University. 2007. Corn & Soybean Field Guide (ID-179). To order, call Purdue Extension toll-free at (888) 398-4636 and ask for the Media Distribution Center.
Wuethrich, Kirby. 1997. Vegetative and Reproductive Phenology of Fourteen Hybrids of Dent Corn (Zea mays L.). M.S. thesis, Purdue Univ.
![]()
Determining Corn Leaf Stages - (Bob Nielsen)
Many of us remember standing against the doorframe in our early years and our parents marking our height with a pencil to measure how much we had grown. Maybe some of you spent more time standing in the corner in your youth, but I won’t comment on that.
Because it is difficult to transport corn plants from the field to that doorframe to measure their growth, agronomists developed other means to measure the phenology or development of corn. Counting the number of leaves would seem to be a simple way to document corn development, but folks still tend to become confused over this simple strategy. There are two basic methods for leaf staging corn in use today.
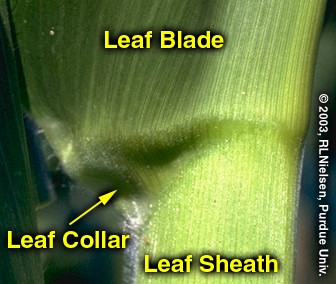
Leaf Collar Method. This method determines leaf stage in corn by counting the number of leaves on a plant with visible leaf collars, beginning with the lowermost, short, rounded-tip true leaf and ending with the uppermost leaf with a visible leaf collar. The leaf collar is the light-colored collar-like “band” located at the base of an exposed leaf blade, near the spot where the leaf blade comes in contact with the stem of the plant.
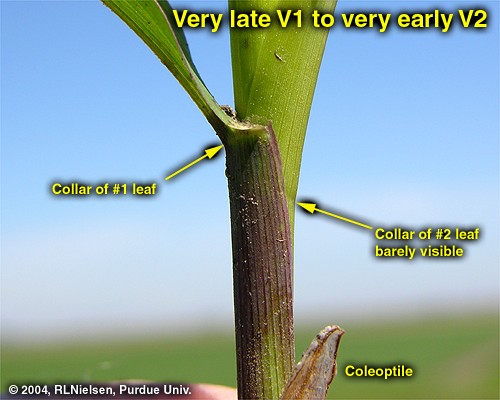
Leaves within the whorl, not yet fully expanded and with no visible leaf collar are not included in this leaf staging method. The exception to this statement may be that leaves with barely visible leaf collars can be counted when you are staging plants early in the day, recognizing that the leaf collar may become completely visible by the end of the day.
Leaf stages are usually described as “V” stages, e.g., V2 = two leaves with visible leaf collars. The leaf collar method is generally the most widely used method by university and industry agronomists in the U.S.
“Droopy” Leaf Method. Crop insurance adjusters, when assessing damage to a corn crop from weather events such as hailstorms, use this leaf staging method. Like the leaf collar method, this method of leaf staging begins with the short first leaf. Leaf counting then differs, though, by ending not with the uppermost leaf with a visible collar, but at that leaf that is at least 40 to 50 percent exposed from the whorl. In knee-high corn or older, the tip of this “indicator” leaf typically also “droops” or hangs down, hence the name “droopy” leaf method.
Leaf collar method
Leaf collar
The Two Methods Compared. Both methods assign a leaf stage to a field on the basis of the leaf stage common to the majority of the plants in the field. Up to the 5- or 6-leaf collar stage, the leaf collar method will typically result in a leaf stage value that is one less than the “droopy” leaf method. After corn reaches 18 to 24 inches in height, the leaf collar method will typically result in a leaf stage value that is two less than the “droopy” leaf method.

V3 plant using leaf collar method

Same plane, but V4 using droopy leaf method
The usefulness in understanding the differences between these two leaf staging methods lies in the fact that the defoliation/yield loss chart used by hail insurance adjusters is based on the “droopy” leaf method. That chart is reproduced in the Purdue Extension publication ID-179, Corn & Soybean Field Guide. Identifying true “droopy” leaves on shredded, hail-damaged corn plants can be quite difficult, whereas leaf collars are often still identifiable. Thus, you can usually stage a damaged crop by the leaf collar method and then add one or two more leaves to the count in order to use the defoliation chart.
What About Herbicide Labels? Growers’ confusion with leaf staging often originates with less than clearly described growth stage restrictions listed on herbicide labels (Loux et al. 2007). Label restrictions of older post-emergence herbicides typically ignored the short first leaf with the rounded tip and ended with the uppermost leaf that was at least 50% exposed from whorl. In essence, this was a bastardized “droopy leaf” method that resulted in roughly the same numerical leaf stage as the leaf collar method. Newer labels purport to define leaf stages according to the leaf collar method, but there is still some question about whether the short first leaf with the rounded tip is included. If in doubt with these newer herbicides, check with your chemical technical representative to verify which leaf staging method is appropriate for the herbicide you intend to use.
Staging Older Plants. As corn plants develop, the lower few leaves typically die or rip away from the stem by expansion of the stalk or by developing roots. Consequently, growth stage identification can be difficult on older plants when you aren’t sure which leaves to begin counting first. But, not to worry, growth staging can still be accomplished!
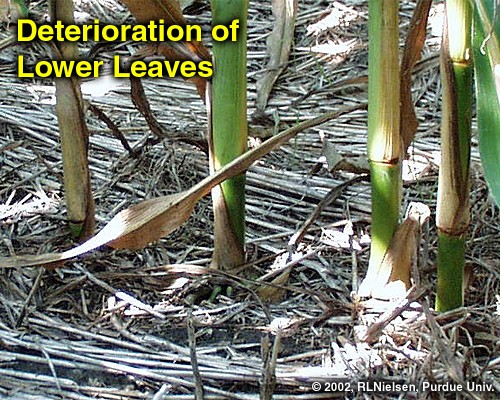
Deterioration of lower leaves
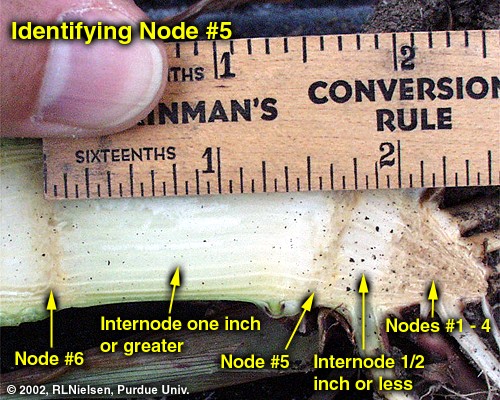
Identifying Node #5
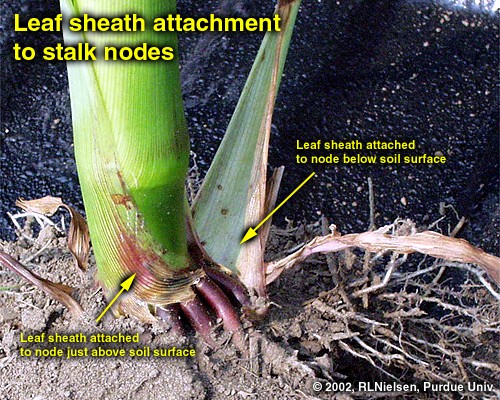
Leaf sheath attachment to stalk nodes
First, dig or pull a plant without breaking the stalk. With a knife, carefully split the stalk down the middle, completely through the root ball. Look for the lowermost obvious internode (the whitish area between the “woody” horizontal stalk nodes) above the triangular “woody” base of the stalk. This first internode’s length is typically only 1/2 to 3/4 inch.
Determine which leaf corresponds with the node immediately above the first noticeable internode by carefully identifying which leaf sheath attaches to the node. This leaf is usually Leaf #5. Once Leaf #5 is identified, then stage the plant by continuing to count the remainder of the leaves with visible leaf collars above Leaf #5. For example, assume you’ve identified Leaf #5 and there are six more leaves above that one with visible leaf collars, then the plant is at leaf stage V11 (11 leaves with visible leaf collars).
Related References
Loux, Mark, Jeff Stachler, Bill Johnson, Glenn Nice, & Tom Bauman. 2007. 2007 Weed Control Guide for Ohio and Indiana (WS-16). Table 7: Rainfast Intervals, Spray Additives, and Maximum Crop Size for Postemergence Corn Herbicides. Purdue Univ. & Ohio State Univ. Coop. Ext. Services. [On-Line]. Available at <http://www.btny.purdue.edu/Pubs/WS/WS-16/CornRainfast.pdf>. (URL verified 4/16/07).
Nielsen, R.L. (Bob). 2007a. Heat Unit Concepts Related to Corn Development. Corny News Network, Purdue Univ. [On-Line]. Available at <http://www.kingcorn.org/news/timeless/HeatUnits.html>. (URL verified 4/16/07).
Nielsen, R.L. (Bob). 2007b. Use Thermal Time to Predict Leaf Stage Development in Corn. Corny News Network, Purdue Univ. [On-Line]. Available at <http://www.kingcorn.org/news/timeless/VStagePrediction.html>. (URL verified 4/16/07).
Purdue University. 2007. Corn & Soybean Field Guide (ID-179). To order, call Purdue Extension toll-free at (888) 398-4636 and ask for the Media Distribution Center.
Ritchie, S.W., J.J. Hanway, and G.O. Benson. 1992. How a Corn Plant Develops (SP-48). Iowa State Univ. [On-Line]. Available at <http://www.extension.iastate.edu/pages/hancock/agriculture/corn/corn_develop/
CornPlantStages.html>. (URL verified 4/16/07).
![]()
Heat Unit Concepts Related to Corn Development - (Bob Nielsen)
Growth and development of corn are strongly dependent on temperature. Corn develops faster when temperatures are warmer and more slowly when temperatures are cooler. For example, a string of warmer than normal days in late spring will encourage faster leaf development than normal. Another example is that a cooler than normal grain filling period will delay the calendar date of grain maturity.
The phrases “string of warmer than normal days” and “cooler than normal grain filling period” can be converted mathematically into measures of thermal time by calculating the daily accumulations of heat. Commonly used terms for thermal time are Growing Degree Days (GDDs), Growing Degree Units (GDUs), or heat units (HUs).
Different methods exist for calculating heat units depending on a) the crop or biological organism of interest and b) the whim or personal preference of the researcher. The calculation method most commonly used throughout the U.S. for determining heat unit accumulation relative to corn phenology is the formula first suggested by the National Oceanic and Atmospheric Administration in 1969 and labeled as the ‘Modified Growing Degree Day’ formula in 1971.
This method calculates daily accumulation of GDDs as the average daily temperature (°F) minus 50. The “modification” refers to the limits imposed on the daily maximum and minimum temperatures allowed in the calculation. Daily maximums greater than 86°F are set equal to 86 in the calculation of the daily average temperature. Similarly, daily minimums less than 50°F are set equal to 50 in the calculation.
Example 1: If the daily maximum temperature was 80°F and the minimum was 55°F, the GDD accumulation for the day would be ((80 + 55)/2) – 50 or 17.5 GDDs.
Example 2: (Illustrating the limit on daily maximums): If the daily maximum temperature was 90°F and the minimum was 72°F, the GDD accumulation for the day would be ((86 + 72)/2) – 50 or 29 GDDs.
Example 3: (Illustrating the limit on daily minimums): If the daily maximum temperature was 68°F and the minimum was 41°F, the GDD accumulation for the day would be ((68 + 50)/2) – 50 or 9 GDDs.
In late April to early May, normal daily GDD accumulations for central Indiana are about 10 GDDs. By late July, the normal daily accumulation rises to about 23 GDDs. For a typical corn growing season in central Indiana, say from late April to late September, the total seasonal accumulation of GDDs is about 2800 GDDs.
Historical normal GDD accumulations on a weekly basis for Indiana’s nine Crop Reporting Districts are listed in Table 1 (on following page) and are also available in Purdue’s Corn & Soybean Field Guide, Extension publication ID-179. Daily or monthly GDD normals for Indiana are available on-line at the Indiana State Climate Office Web site at <http://agmetx.agry.purdue.edu/sc.norm-geog.html> (URL verified 4/16/07).
Obviously, the ability to calculate daily heat unit accumulations is dependent on your having access to daily maximum and minimum temperatures. If you do not have your own max/min recording thermometer, you can guesstimate the daily highs and lows by manually recording the temperatures shortly after sunrise (approximate daily low) and late in the afternoon (approximate daily high).
In lieu of recording your own daily temperatures, you can use those of an official weather reporting station nearest to your location. Daily temperature data and GDD accumulations at various Indiana locations are available for user-specified time periods at the Indiana State Climate Office Web site on-line at <http://agmetx.agry.purdue.edu/sc.obs-geog.html> (URL verified 4/16/07). Also, the weekly Purdue Pest & Crop Newsletter lists accumulated GDDs for selected sites across the state based on various start dates.
Related References
Corn & Soybean Field Guide (ID-179). 2007. Purdue Univ. Extension. To order, call Purdue Extension toll-free at (888) 398-4636.
Nielsen, R.L. (Bob). 2007a. Determining Corn Leaf Stages. Corny News Network, Purdue Univ. [On-Line]. Available at <http://www.kingcorn.org/news/timeless/VStageMethods.html>. (URL verified 4/16/07).
Nielsen, R.L. (Bob). 2007b. Use Thermal Time to Predict Leaf Stage Development in Corn. Corny News Network, Purdue Univ. [On-Line]. Available at <http://www.kingcorn.org/news/timeless/VStagePrediction.html>. (URL verified 4/16/07).
Purdue Pest & Crop Newsletter. 2007. Purdue Univ. Pest Mgmt. Program. [On-Line]. Available at <http://www.entm.purdue.edu/entomology/ext/ext_newsletters.html>. (URL verified 4/16/07).
For other Corny News Network articles, browse through the CNN Archives at <http://www.kingcorn.org/news/archive.html>.
For other information about corn, take a look at the Corn Growers’ Guidebook at <http://www.kingcorn.org>.
![]()